
Page 248 - Design for Six Sigma a Roadmap for Product Development
P. 248
218 Chapter Seven
Another technique is the tree diagram, which is a step beyond the
affinity diagram. The tree diagram is used mainly to fill the gaps and
cavities not detected previously in order to achieve a more completed
structure leading to more ideas. Such expansion of ideas will allow the
structure to grow but at the same time will provide more vision into
the voice of the customer (Cohen 1988).
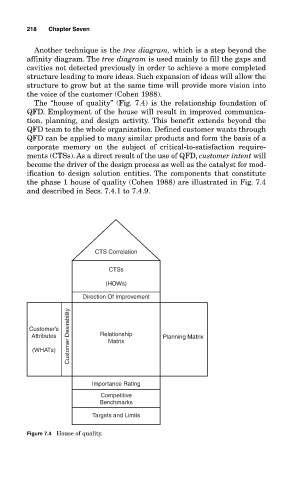
The “house of quality” (Fig. 7.4) is the relationship foundation of
QFD. Employment of the house will result in improved communica-
tion, planning, and design activity. This benefit extends beyond the
QFD team to the whole organization. Defined customer wants through
QFD can be applied to many similar products and form the basis of a
corporate memory on the subject of critical-to-satisfaction require-
ments (CTSs). As a direct result of the use of QFD, customer intent will
become the driver of the design process as well as the catalyst for mod-
ification to design solution entities. The components that constitute
the phase 1 house of quality (Cohen 1988) are illustrated in Fig. 7.4
and described in Secs. 7.4.1 to 7.4.9.
CTS Correlation
CTSs
(HOWs)
Direction Of Improvement
Customer Desirability Matrix
Customer’s
Attributes Relationship Planning Matrix
(WHATs)
Importance Rating
Competitive
Benchmarks
Targets and Limits
Figure 7.4 House of quality.