
Page 441 - Design for Six Sigma a Roadmap for Product Development
P. 441
Failure Mode–Effect Analysis 403
Battery Voltage
Switch
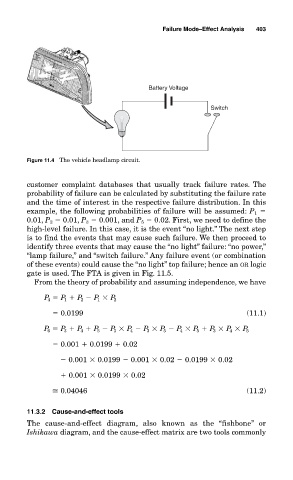
Figure 11.4 The vehicle headlamp circuit.
customer complaint databases that usually track failure rates. The
probability of failure can be calculated by substituting the failure rate
and the time of interest in the respective failure distribution. In this
example, the following probabilities of failure will be assumed: P 1
0.01, P 2 0.01, P 3 0.001, and P 5 0.02. First, we need to define the
high-level failure. In this case, it is the event “no light.” The next step
is to find the events that may cause such failure. We then proceed to
identify three events that may cause the “no light” failure: “no power,”
“lamp failure,” and “switch failure.” Any failure event (or combination
of these events) could cause the “no light” top failure; hence an OR logic
gate is used. The FTA is given in Fig. 11.5.
From the theory of probability and assuming independence, we have
P 4 P 1 P 2 P 1
P 2
0.0199 (11.1)
P 6 P 3 P 4 P 5 P 3
P 4 P 3
P 5 P 4
P 5 P 3
P 4
P 5
0.001 0.0199 0.02
0.001
0.0199 0.001
0.02 0.0199
0.02
0.001
0.0199
0.02
0.04046 (11.2)
11.3.2 Cause-and-effect tools
The cause-and-effect diagram, also known as the “fishbone” or
Ishikawa diagram, and the cause-effect matrix are two tools commonly