
Page 442 - Design for Six Sigma a Roadmap for Product Development
P. 442
404 Chapter Eleven
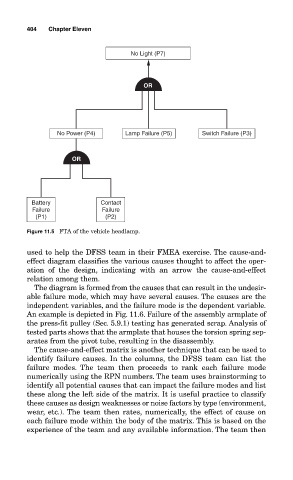
No Light (P7)
OR
No Power (P4) Lamp Failure (P5) Switch Failure (P3)
OR
Battery Contact
Failure Failure
(P1) (P2)
Figure 11.5 FTA of the vehicle headlamp.
used to help the DFSS team in their FMEA exercise. The cause-and-
effect diagram classifies the various causes thought to affect the oper-
ation of the design, indicating with an arrow the cause-and-effect
relation among them.
The diagram is formed from the causes that can result in the undesir-
able failure mode, which may have several causes. The causes are the
independent variables, and the failure mode is the dependent variable.
An example is depicted in Fig. 11.6. Failure of the assembly armplate of
the press-fit pulley (Sec. 5.9.1) testing has generated scrap. Analysis of
tested parts shows that the armplate that houses the torsion spring sep-
arates from the pivot tube, resulting in the disassembly.
The cause-and-effect matrix is another technique that can be used to
identify failure causes. In the columns, the DFSS team can list the
failure modes. The team then proceeds to rank each failure mode
numerically using the RPN numbers. The team uses brainstorming to
identify all potential causes that can impact the failure modes and list
these along the left side of the matrix. It is useful practice to classify
these causes as design weaknesses or noise factors by type (environment,
wear, etc.). The team then rates, numerically, the effect of cause on
each failure mode within the body of the matrix. This is based on the
experience of the team and any available information. The team then