
Page 484 - Design for Six Sigma a Roadmap for Product Development
P. 484
Fundamentals of Experimental Design 443
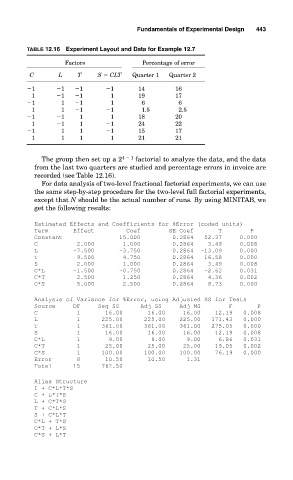
TABLE 12.16 Experiment Layout and Data for Example 12.7
Factors Percentage of error
C L T S CLT Quarter 1 Quarter 2
1 1 1 1 14 16
1 1 1 1 19 17
1 1 1 1 6 6
1 1 1 1 1.5 2.5
1 1 1 1 18 20
1 1 1 1 24 22
1 1 1 1 15 17
1 1 1 1 21 21
The group then set up a 2 4 1 factorial to analyze the data, and the data
from the last two quarters are studied and percentage errors in invoice are
recorded (see Table 12.16).
For data analysis of two-level fractional factorial experiments, we can use
the same step-by-step procedure for the two-level full factorial experiments,
except that N should be the actual number of runs. By using MINITAB, we
get the following results:
Estimated Effects and Coefficients for %Error (coded units)
Term Effect Coef SE Coef T P
Constant 15.000 0.2864 52.37 0.000
C 2.000 1.000 0.2864 3.49 0.008
L -7.500 -3.750 0.2864 -13.09 0.000
T 9.500 4.750 0.2864 16.58 0.000
S 2.000 1.000 0.2864 3.49 0.008
C*L -1.500 -0.750 0.2864 -2.62 0.031
C*T 2.500 1.250 0.2864 4.36 0.002
C*S 5.000 2.500 0.2864 8.73 0.000
Analysis of Variance for %Error, using Adjusted SS for Tests
Source DF Seq SS Adj SS Adj MS F P
C 1 16.00 16.00 16.00 12.19 0.008
L 1 225.00 225.00 225.00 171.43 0.000
T 1 361.00 361.00 361.00 275.05 0.000
S 1 16.00 16.00 16.00 12.19 0.008
C*L 1 9.00 9.00 9.00 6.86 0.031
C*T 1 25.00 25.00 25.00 19.05 0.002
C*S 1 100.00 100.00 100.00 76.19 0.000
Error 8 10.50 10.50 1.31
Total 15 762.50
Alias Structure
I + C*L*T*S
C + L*T*S
L + C*T*S
T + C*L*S
S + C*L*T
C*L + T*S
C*T + L*S
C*S + L*T