
Page 486 - Design for Six Sigma a Roadmap for Product Development
P. 486
Fundamentals of Experimental Design 445
C L T S
20.0
17.5
% Error 15.0
12.5
10.0
–1 1 –1 1 –1 1 –1 1
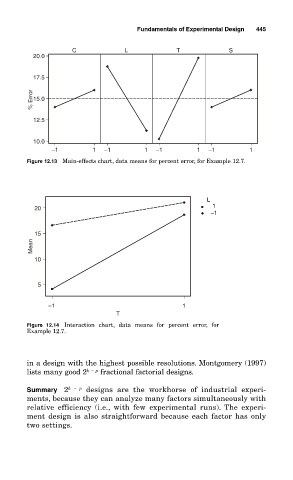
Figure 12.13 Main-effects chart, data means for percent error, for Example 12.7.
L
1
20
–1
15
Mean
10
5
–1 1
T
Figure 12.14 Interaction chart, data means for percent error, for
Example 12.7.
in a design with the highest possible resolutions. Montgomery (1997)
lists many good 2 k p fractional factorial designs.
Summary 2 k p designs are the workhorse of industrial experi-
ments, because they can analyze many factors simultaneously with
relative efficiency (i.e., with few experimental runs). The experi-
ment design is also straightforward because each factor has only
two settings.