
Page 490 - Design for Six Sigma a Roadmap for Product Development
P. 490
Fundamentals of Experimental Design 449
TABLE 12.18 Experiment Layout and Data for Example 12.8
Factors Response measurement standard
Run number Wind Temperature 1 2 3
1 Low Low 0.4 0.8 0.6
2 Low Mid 0.7 0.5 0.3
3 Low High 2.6 3.2 2.8
4 Mid Low 1.0 0.8 0.7
5 Mid Mid 0.5 1.3 0.6
6 Mid High 3.6 2.5 3.5
7 High Low 2.1 1.6 0.8
8 High Mid 1.3 0.5 1.6
9 High High 1.5 4.3 2.6
Wind Temperature
3.0
2.2
Deviation 1.4
0.6
–0.2
0 1 2 0 1 2
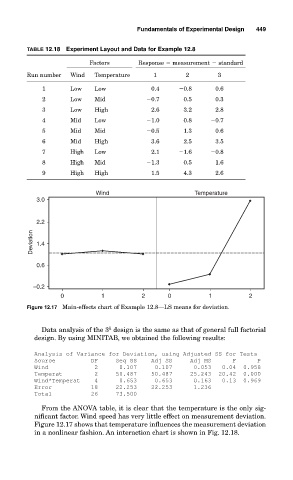
Figure 12.17 Main-effects chart of Example 12.8—LS means for deviation.
Data analysis of the 3 design is the same as that of general full factorial
k
design. By using MINITAB, we obtained the following results:
Analysis of Variance for Deviation, using Adjusted SS for Tests
Source DF Seq SS Adj SS Adj MS F P
Wind 2 0.107 0.107 0.053 0.04 0.958
Temperat 2 50.487 50.487 25.243 20.42 0.000
Wind*Temperat 4 0.653 0.653 0.163 0.13 0.969
Error 18 22.253 22.253 1.236
Total 26 73.500
From the ANOVA table, it is clear that the temperature is the only sig-
nificant factor. Wind speed has very little effect on measurement deviation.
Figure 12.17 shows that temperature influences the measurement deviation
in a nonlinear fashion. An interaction chart is shown in Fig. 12.18.