
Page 485 - Design for Six Sigma a Roadmap for Product Development
P. 485
444 Chapter Twelve
A: C
B: L
C
C: T
D: S
B
AD
AC
D
A
AB
0 5 10 15
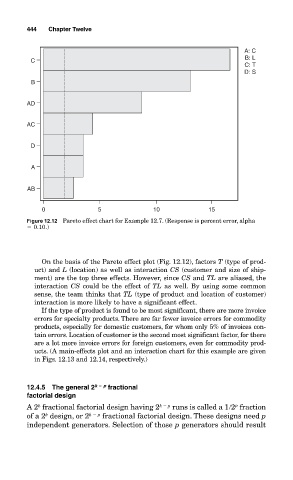
Figure 12.12 Pareto effect chart for Example 12.7. (Response is percent error, alpha
0.10.)
On the basis of the Pareto effect plot (Fig. 12.12), factors T (type of prod-
uct) and L (location) as well as interaction CS (customer and size of ship-
ment) are the top three effects. However, since CS and TL are aliased, the
interaction CS could be the effect of TL as well. By using some common
sense, the team thinks that TL (type of product and location of customer)
interaction is more likely to have a significant effect.
If the type of product is found to be most significant, there are more invoice
errors for specialty products. There are far fewer invoice errors for commodity
products, especially for domestic customers, for whom only 5% of invoices con-
tain errors. Location of customer is the second most significant factor, for there
are a lot more invoice errors for foreign customers, even for commodity prod-
ucts. (A main-effects plot and an interaction chart for this example are given
in Figs. 12.13 and 12.14, respectively.)
12.4.5 The general 2 k p fractional
factorial design
p
A 2 fractional factorial design having 2 k p runs is called a 1 2 fraction
k
k
of a 2 design, or 2 k p fractional factorial design. These designs need p
independent generators. Selection of those p generators should result