
Page 493 - Design for Six Sigma a Roadmap for Product Development
P. 493
452 Chapter Twelve
experiment. The first three methods are based on estimating miss-
ing data, by using different approaches. The fourth method is based
on stepwise regression.
Method 1: Draper and Stoneman’s method. This method was proposed
by Draper and Stoneman in 1964 and was further discussed by George
Box in 1990. We will use Example 12.9 to illustrate how the Draper
and Stoneman method works.
Example 12.9. Draper and Stoneman’s Method The data used in this
example are adapted from Example 12.6 of this book and are listed in
Table 12.19.
Recall that in Example 12.6, there are two replicates of responses, and
they are the shrinkage for the parts made by an injection molding process.
In this example, we compute the average shrinkage of the two replicated
observations in each experimental run and use the average shrinkage as the
response Y, in Table 12.19.
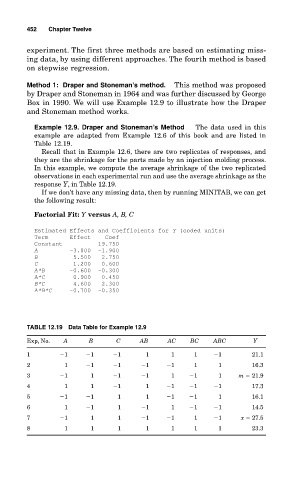
If we don’t have any missing data, then by running MINITAB, we can get
the following result:
Factorial Fit: Y versus A, B, C
Estimated Effects and Coefficients for Y (coded units)
Term Effect Coef
Constant 19.750
A -3.800 -1.900
B 5.500 2.750
C 1.200 0.600
A*B -0.600 -0.300
A*C 0.900 0.450
B*C 4.600 2.300
A*B*C -0.700 -0.350
TABLE 12.19 Data Table for Example 12.9
Exp, No. A B C AB AC BC ABC Y
1 1 1 1 1 1 1 1 21.1
2 1 1 1 1 1 1 1 16.3
3 1 1 1 1 1 1 1 m 21.9
4 1 1 1 1 1 1 1 17.3
5 1 1 1 1 1 1 1 16.1
6 1 1 1 1 1 1 1 14.5
7 1 1 1 1 1 1 1 x 27.5
8 1 1 1 1 1 1 1 23.3