Page 551 - Design for Six Sigma a Roadmap for Product Development
P. 551
510   Chapter Fourteen


                                             1  n
                                    ^
                      (14.13)
                                        y
                                             n  i   1  y i
                                      2
           The statistical estimate for   is
                                           1    n
                               ^ 2   2
   (y i   y) 2        (14.14)
                                   s

                                         n   1  i   1
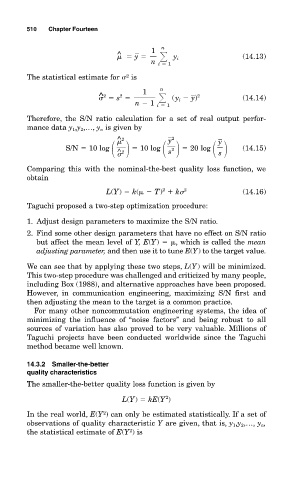
           Therefore, the S/N ratio calculation for a set of real output perfor-
           mance data y 1 ,y 2 ,…, y n is given by
                                                   2
                                    ^ 2

                                                  y

                                                               y


                      S/N   10 log        10 log        20 log        (14.15)
                                                   2
                                                  s
                                    ^ 2
                                                               s

           Comparing this with the nominal-the-best quality loss function, we
           obtain
                                                2
                                 L(Y)   k(   T)   k   2               (14.16)
           Taguchi proposed a two-step optimization procedure:
           1. Adjust design parameters to maximize the S/N ratio.
           2. Find some other design parameters that have no effect on S/N ratio
              but affect the mean level of Y, E(Y)   , which is called the mean
              adjusting parameter, and then use it to tune E(Y) to the target value.
           We can see that by applying these two steps, L(Y) will be minimized.
           This two-step procedure was challenged and criticized by many people,
           including Box (1988), and alternative approaches have been proposed.
           However, in communication engineering, maximizing S/N first and
           then adjusting the mean to the target is a common practice.
             For many other noncommutation engineering systems, the idea of
           minimizing the influence of  “noise factors” and being robust to all
           sources of variation has also proved to be very valuable. Millions of
           Taguchi projects have been conducted worldwide since the  Taguchi
           method became well known.

           14.3.2 Smaller-the-better
           quality characteristics
           The smaller-the-better quality loss function is given by

                                                 2
                                     L(Y)   kE(Y )
                                2
           In the real world, E(Y ) can only be estimated statistically. If a set of
           observations of quality characteristic Y are given, that is, y 1 ,y 2 ,…, y n ,
                                       2
           the statistical estimate of E(Y ) is

