
Page 553 - Design for Six Sigma a Roadmap for Product Development
P. 553
512 Chapter Fourteen
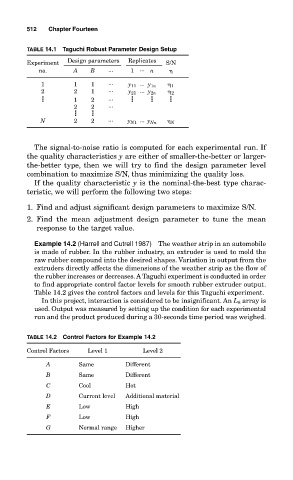
TABLE 14.1 Taguchi Robust Parameter Design Setup
Experiment Design parameters Replicates S/N
no. A B ... 1 ... n
1 1 1 ... y 11 ... y 1n 1
2 2 1 ... y 21 ... y 2n 2
1 2 ...
2 2 ...
N 2 2 ... y N1 ... y Nn N
The signal-to-noise ratio is computed for each experimental run. If
the quality characteristics y are either of smaller-the-better or larger-
the-better type, then we will try to find the design parameter level
combination to maximize S/N, thus minimizing the quality loss.
If the quality characteristic y is the nominal-the-best type charac-
teristic, we will perform the following two steps:
1. Find and adjust significant design parameters to maximize S/N.
2. Find the mean adjustment design parameter to tune the mean
response to the target value.
Example 14.2 (Harrell and Cutrell 1987) The weather strip in an automobile
is made of rubber. In the rubber industry, an extruder is used to mold the
raw rubber compound into the desired shapes. Variation in output from the
extruders directly affects the dimensions of the weather strip as the flow of
the rubber increases or decreases. A Taguchi experiment is conducted in order
to find appropriate control factor levels for smooth rubber extruder output.
Table 14.2 gives the control factors and levels for this Taguchi experiment.
In this project, interaction is considered to be insignificant. An L 8 array is
used. Output was measured by setting up the condition for each experimental
run and the product produced during a 30-seconds time period was weighed.
TABLE 14.2 Control Factors for Example 14.2
Control Factors Level 1 Level 2
A Same Different
B Same Different
C Cool Hot
D Current level Additional material
E Low High
F Low High
G Normal range Higher