
Page 624 - Design for Six Sigma a Roadmap for Product Development
P. 624
Tolerance Design 577
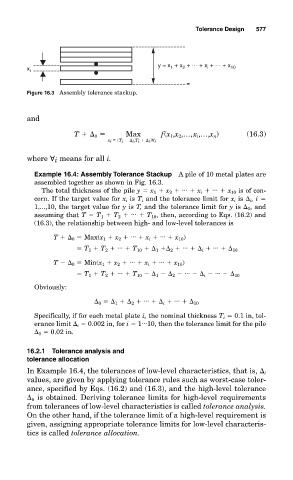
y = x + x + … + x + … + x
x i 1 2 i 10
Figure 16.3 Assembly tolerance stackup.
and
T 0 Max f(x 1 ,x 2 ,…,x i ,…,x n ) (16.3)
x i ∈ (T i i ,T i i ) i
where means for all i.
i
Example 16.4: Assembly Tolerance Stackup A pile of 10 metal plates are
assembled together as shown in Fig. 16.3.
The total thickness of the pile y x 1 x 2 ... x i ... x 10 is of con-
cern. If the target value for x i is T i and the tolerance limit for x i is i , i
1,...,10, the target value for y is T, and the tolerance limit for y is 0 , and
assuming that T T 1 T 2 ... T 10 , then, according to Eqs. (16.2) and
(16.3), the relationship between high- and low-level tolerances is
T 0 Max(x 1 x 2 ... x i ... x 10 )
T 1 T 2 ... T 10 1 2 ... i ... 10
T 0 Min(x 1 x 2 ... x i ... x 10 )
T 1 T 2 ... T 10 1 2 ... i ... 10
Obviously:
0 1 2 ... i ... 10
Specifically, if for each metal plate i, the nominal thickness T i 0.1 in, tol-
...
erance limit i 0.002 in, for i 1 10, then the tolerance limit for the pile
0 0.02 in.
16.2.1 Tolerance analysis and
tolerance allocation
In Example 16.4, the tolerances of low-level characteristics, that is, i
values, are given by applying tolerance rules such as worst-case toler-
ance, specified by Eqs. (16.2) and (16.3), and the high-level tolerance
0 is obtained. Deriving tolerance limits for high-level requirements
from tolerances of low-level characteristics is called tolerance analysis.
On the other hand, if the tolerance limit of a high-level requirement is
given, assigning appropriate tolerance limits for low-level characteris-
tics is called tolerance allocation.