
Page 144 - Design for Six Sigma for Service (Six SIGMA Operational Methods)
P. 144
Quality Function Deployment 119
Direction of improvement % of employees trained Close the deal cycle time
Direction of improvement Use of standardized documents and tools Updating of customer account data Importance of the part attributes Relative importance of part attributes
Maximize 1.0 Systems uptime Discovery cycle time Setup cycle time Prospecting cycle time
Target 0.0 Target values
Minimize −1.0
1 1 2 3 4 5 6 7 8 1 2 3
Direction of improvement 1
First call resolution % 1 5103.015.8 = 80% first call resolution 1
100% of service requests resolved by
% Svc Req Res by promise date 2 5004.015.5 2
promise date
% Total portfolio reviewed/year 3 4266.013.2 10% 3
% Discovery document complete 4 3618.011.2 100% 4
Sales cycle time 5 1911.0 5.9 60 days 5
Customer satisfaction rating 6 3927.012.1 6
% AMCSAs >= 2 competency 7 3159.0 9.8 80% 7
model
Average speed of answer 8 1278.0 4.0 80% of calls answered in <24 seconds 8
Losses due to price 9 1356.0 4.2 <10% 9
% CSAs >= 27 call coaching 10 2718.0 8.4 80% 10
Importance of process attributes 1 24.9 647.7 22.7 590.3 18.6 483.3 17.1 443.7 202.9 89.6 89.6 53.2
Relative importance of process 2 7.8 3.4 3.4 2.0 Standard 9-3-1
attributes Strong 9.0
Used 90% of the time 95% system uptime
Target values 3 Moderate 3.0
Weak 1.0
100% Nightly update 10 days 45 days 12 days 5 days
1 2 3 4 5 6 7 8
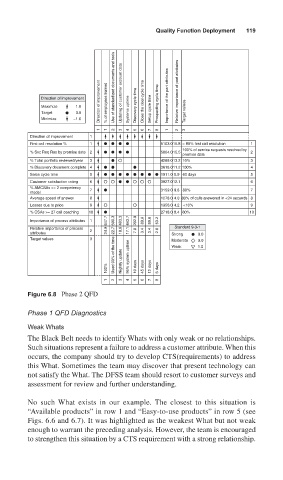
Figure 6.8 Phase 2 QFD
Phase 1 QFD Diagnostics
Weak Whats
The Black Belt needs to identify Whats with only weak or no relationships.
Such situations represent a failure to address a customer attribute. When this
occurs, the company should try to develop CTS(requirements) to address
this What. Sometimes the team may discover that present technology can
not satisfy the What. The DFSS team should resort to customer surveys and
assessment for review and further understanding.
No such What exists in our example. The closest to this situation is
“Available products” in row 1 and “Easy-to-use products” in row 5 (see
Figs. 6.6 and 6.7). It was highlighted as the weakest What but not weak
enough to warrant the preceding analysis. However, the team is encouraged
to strengthen this situation by a CTS requirement with a strong relationship.