
Page 406 - Design for Six Sigma for Service (Six SIGMA Operational Methods)
P. 406
366 Chapter Ten
sale order process. The lighter shaded boxes are value-added steps; the
darker shaded boxes are non-value-added steps. The first box, Search,
does not really add value for customers, but it is an essential step for now,
so a lighter shaded box is used.
In many service processes, the simplified value stream map as shown by
Fig. 10.15 is sufficient to map the process and identify and quantify the
wastes in the process. In some cases, the simplified value stream map is
not sufficient to describe the process; in this case, a more formal type of
value stream map illustrated in Sec. 10.4.3 can be used to map the
process.
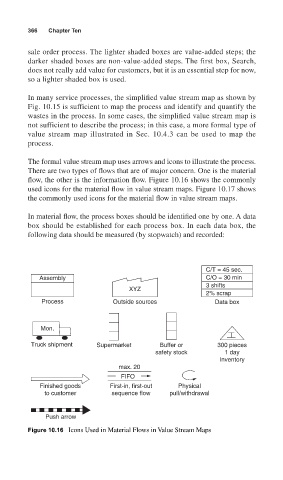
The formal value stream map uses arrows and icons to illustrate the process.
There are two types of flows that are of major concern. One is the material
flow, the other is the information flow. Figure 10.16 shows the commonly
used icons for the material flow in value stream maps. Figure 10.17 shows
the commonly used icons for the material flow in value stream maps.
In material flow, the process boxes should be identified one by one. A data
box should be established for each process box. In each data box, the
following data should be measured (by stopwatch) and recorded:
C/T = 45 sec.
Assembly C/O = 30 min
3 shifts
XYZ
2% scrap
Process Outside sources Data box
Mon.
Truck shipment Supermarket Buffer or 300 pieces
safety stock 1 day
Inventory
max. 20
FIFO
Finished goods First-in, first-out Physical
to customer sequence flow pull/withdrawal
Push arrow
Figure 10.16 Icons Used in Material Flows in Value Stream Maps