
Page 407 - Design for Six Sigma for Service (Six SIGMA Operational Methods)
P. 407
Design and Improvement of Service Processes—Process Management 367
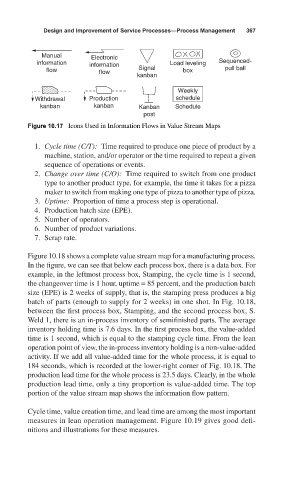
Manual Electronic
information information Load leveling Sequenced-
flow flow Signal box pull ball
kanban
Weekly
Withdrawal Production schedule
kanban kanban Kanban Schedule
post
Figure 10.17 Icons Used in Information Flows in Value Stream Maps
1. Cycle time (C/T): Time required to produce one piece of product by a
machine, station, and/or operator or the time required to repeat a given
sequence of operations or events.
2. Change over time (C/O): Time required to switch from one product
type to another product type, for example, the time it takes for a pizza
maker to switch from making one type of pizza to another type of pizza.
3. Uptime: Proportion of time a process step is operational.
4. Production batch size (EPE).
5. Number of operators.
6. Number of product variations.
7. Scrap rate.
Figure 10.18 shows a complete value stream map for a manufacturing process.
In the figure, we can see that below each process box, there is a data box. For
example, in the leftmost process box, Stamping, the cycle time is 1 second,
the changeover time is 1 hour, uptime = 85 percent, and the production batch
size (EPE) is 2 weeks of supply, that is, the stamping press produces a big
batch of parts (enough to supply for 2 weeks) in one shot. In Fig. 10.18,
between the first process box, Stamping, and the second process box, S.
Weld 1, there is an in-process inventory of semifinished parts. The average
inventory holding time is 7.6 days. In the first process box, the value-added
time is 1 second, which is equal to the stamping cycle time. From the lean
operation point of view, the in-process inventory holding is a non-value-added
activity. If we add all value-added time for the whole process, it is equal to
184 seconds, which is recorded at the lower-right corner of Fig. 10.18. The
production lead time for the whole process is 23.5 days. Clearly, in the whole
production lead time, only a tiny proportion is value-added time. The top
portion of the value stream map shows the information flow pattern.
Cycle time, value creation time, and lead time are among the most important
measures in lean operation management. Figure 10.19 gives good defi-
nitions and illustrations for these measures.