
Page 415 - Design for Six Sigma for Service (Six SIGMA Operational Methods)
P. 415
374 Chapter Ten
the inventory person in the supermarket will refill the same amount of items
by pulling them from the warehouse; then the warehouse person will order
roughly the same amount of items that were pulled from the warehouse.
Restaurant operation is a perfect example of pull-based production. The
customer places the order, and then the kitchen produces exactly what the
customer ordered. In general, the key feature for pull-based production is
that the information flow direction is opposite to that of the material flow.
The information flow means the production control order. In the restaurant
case, the production control is the order for the kitchen to cook. This order’s
direction is from customer to kitchen; on the other hand, the direction of
material flow is the flow of food in the restaurant case, the direction from the
kitchen to the customer. Clearly, the information flow direction and material
flow direction in the restaurant kitchen are opposite to each other.
The opposite of pull-based production is push-based production. The key
feature for the push-based production is that the direction of information
flow is the same as that of the material flow. In push-based production, each
work stop sends the work downstream of the operation, that is, pushes the
work downstream, without considering whether the downstream areas can
make use of it. Typically, activities are planned centrally but do not reflect
actual conditions in terms of idle time, inventory, and queues.
Agricultural production is a typical push-based production. Because the
production cycle is very long, there is no way that farmers can produce only
the amount of food based on real-time demand. The production plan is
purely based on market forecasts and sometimes just based on last year’s
production. The production command will flow in the same direction as the
work flow. It is well known that agricultural production often suffers from
oversupply and market fluctuations. Clearly, pull-based production,
whenever possible, will create much less overproduction, so the waste
caused by overproduction can be reduced.
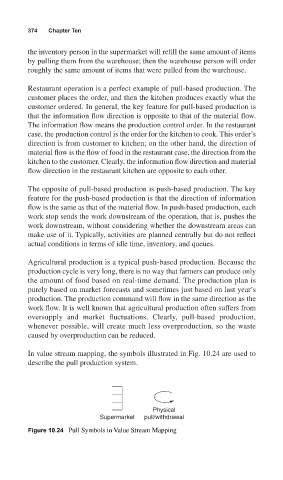
In value stream mapping, the symbols illustrated in Fig. 10.24 are used to
describe the pull production system.
Physical
Supermarket pull/withdrawal
Figure 10.24 Pull Symbols in Value Stream Mapping