
Page 377 - Design of Reinforced Masonry Structures
P. 377
6.28 CHAPTER SIX
2
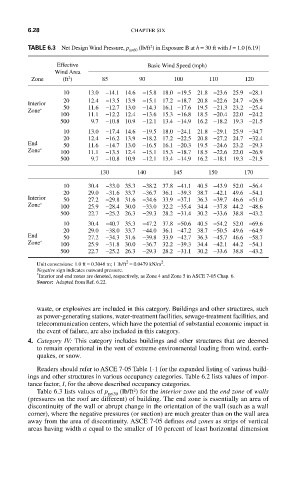
TABLE 6.3 Net Design Wind Pressure, p net30 (lb/ft ) in Exposure B at h = 30 ft with I = 1.0 [6.19]
Effective Basic Wind Speed (mph)
Wind Area
2
Zone (ft ) 85 90 100 110 120
10 13.0 –14.1 14.6 −15.8 18.0 −19.5 21.8 −23.6 25.9 −28.1
20 12.4 −13.5 13.9 −15.1 17.2 −18.7 20.8 −22.6 24.7 −26.9
Interior
Zone ∗ 50 11.6 −12.7 13.0 −14.3 16.1 −17.6 19.5 −21.3 23.2 −25.4
100 11.1 −12.2 12.4 −13.6 15.3 −16.8 18.5 −20.4 22.0 −24.2
500 9.7 −10.8 10.9 −12.1 13.4 −14.9 16.2 −18.2 19.3 −21.5
10 13.0 −17.4 14.6 −19.5 18.0 −24.1 21.8 −29.1 25.9 −34.7
20 12.4 −16.2 13.9 −18.2 17.2 −22.5 20.8 −27.2 24.7 −32.4
End 50 11.6 −14.7 13.0 −16.5 16.1 −20.3 19.5 −24.6 23.2 −29.3
Zone ∗ 100 11.1 −13.5 12.4 −15.1 15.3 −18.7 18.5 −22.6 22.0 −26.9
500 9.7 −10.8 10.9 −12.1 13.4 −14.9 16.2 −18.1 19.3 −21.5
130 140 145 150 170
10 30.4 −33.0 35.3 −38.2 37.8 −41.1 40.5 −43.9 52.0 −56.4
20 29.0 −31.6 33.7 −36.7 36.1 −39.3 38.7 −42.1 49.6 −54.1
Interior 50 27.2 −29.8 31.6 −34.6 33.9 −37.1 36.3 −39.7 46.6 −51.0
Zone ∗ 100 25.9 −28.4 30.0 −33.0 32.2 −35.4 34.4 −37.8 44.2 −48.6
500 22.7 −25.2 26.3 −29.3 28.2 −31.4 30.2 −33.6 38.8 −43.2
10 30.4 −40.7 35.3 −47.2 37.8 −50.6 40.5 −54.2 52.0 −69.6
20 29.0 −38.0 33.7 −44.0 36.1 −47.2 38.7 −50.5 49.6 −64.9
End 50 27.2 −34.3 31.6 −39.8 33.9 −42.7 36.3 −45.7 46.6 −58.7
Zone ∗ 100 25.9 −31.8 30.0 −36.7 32.2 −39.3 34.4 −42.1 44.2 −54.1
500 22.7 −25.2 26.3 −29.3 28.2 −31.1 30.2 −33.6 38.8 −43.2
2
Unit conversions: 1.0 ft = 0.3048 m; 1 lb/ft = 0.0479 kN/m . 2
Negative sign indicates outward pressure.
∗
Interior and end zones are denoted, respectively, as Zone 4 and Zone 5 in ASCE 7-05 Chap. 6.
Source: Adapted from Ref. 6.22.
waste, or explosives are included in this category. Buildings and other structures, such
as power-generating stations, water-treatment facilities, sewage-treatment facilities, and
telecommunication centers, which have the potential of substantial economic impact in
the event of failure, are also included in this category.
4. Category IV: This category includes buildings and other structures that are deemed
to remain operational in the vent of extreme environmental loading from wind, earth-
quakes, or snow.
Readers should refer to ASCE 7-05 Table 1-1 for the expanded listing of various build-
ings and other structures in various occupancy categories. Table 6.2 lists values of impor-
tance factor, I, for the above described occupancy categories.
2
Table 6.3 lists values of p net30 (lb/ft ) for the interior zone and the end zone of walls
(pressures on the roof are different) of building. The end zone is essentially an area of
discontinuity of the wall or abrupt change in the orientation of the wall (such as a wall
corner), where the negative pressures (or suction) are much greater than on the wall area
away from the area of discontinuity. ASCE 7-05 defines end zones as strips of vertical
areas having width a equal to the smaller of 10 percent of least horizontal dimension