
Page 136 - Design of Simple and Robust Process Plants
P. 136
4.2 The Methodology of Process Synthesis 121
Temperature Temperature
Hot utility
Hot utility
HP
steam
Hot streams
MP steam
Utility pinches
∆ T
min
Process
pinch
Cold streams
Cold utility
Cold utility
Enthalpy ∆ Enthalpy
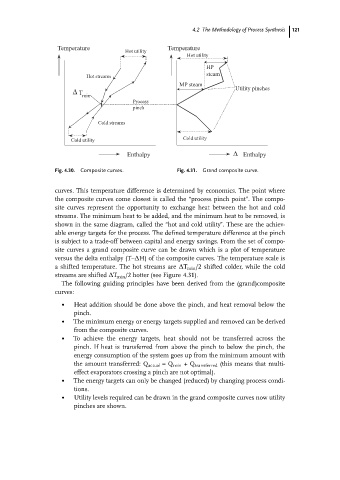
Fig. 4.30. Composite curves. Fig. 4.31. Grand composite curve.
curves. This temperature difference is determined by economics. The point where
the composite curves come closest is called the ªprocess pinch pointº. The compo-
site curves represent the opportunity to exchange heat between the hot and cold
streams. The minimum heat to be added, and the minimum heat to be removed, is
shown in the same diagram, called the ªhot and cold utilityº. These are the achiev-
able energy targets for the process. The defined temperature difference at the pinch
is subject to a trade-off between capital and energy savings. From the set of compo-
site curves a grand composite curve can be drawn which is a plot of temperature
versus the delta enthalpy (T±DH) of the composite curves. The temperature scale is
a shifted temperature. The hot streams are DT min /2 shifted colder, while the cold
streams are shifted DT min /2 hotter (see Figure 4.31).
The following guiding principles have been derived from the (grand)composite
curves:
. Heat addition should be done above the pinch, and heat removal below the
pinch.
. The minimum energy or energy targets supplied and removed can be derived
from the composite curves.
. To achieve the energy targets, heat should not be transferred across the
pinch. If heat is transferred from above the pinch to below the pinch, the
energy consumption of the system goes up from the minimum amount with
the amount transferred: Q actual =Q min +Q transferred (this means that multi-
effect evaporators crossing a pinch are not optimal).
. The energy targets can only be changed (reduced) by changing process condi-
tions.
. Utility levels required can be drawn in the grand composite curves now utility
pinches are shown.