
Page 141 - Design of Simple and Robust Process Plants
P. 141
126 Chapter 4 Process Synthesis and Design Optimization
T 2 T 1
Flow A
Flow B
T 3 T 4
E = E -E losses
B
A
E TH
E Losses =E TH +E P +E HL E P
E HL
E A E B
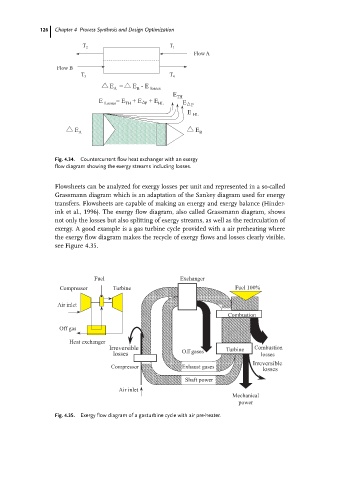
Fig. 4.34. Countercurrent flow heat exchanger with an exergy
flow diagram showing the exergy streams including losses.
Flowsheets can be analyzed for exergy losses per unit and represented in a so-called
Grassmann diagram which is an adaptation of the Sankey diagram used for energy
transfers. Flowsheets are capable of making an energy and exergy balance (Hinder-
ink et al., 1996). The exergy flow diagram, also called Grassmann diagram, shows
not only the losses but also splitting of exergy streams, as well as the recirculation of
exergy. A good example is a gas turbine cycle provided with a air preheating where
the exergy flow diagram makes the recycle of exergy flows and losses clearly visible,
see Figure 4.35.
Fig. 4.35. Exergy flow diagram of a gasturbine cycle with air pre-heater.