
Page 292 - Design of Simple and Robust Process Plants
P. 292
278 Chapter 7 Optimization of an Integrated Complex of Process Plants
. A parametric technique is often applied which is called the Beta Factor model
(Mosleh et al.,1988). This techniques introduces for each component an inde-
pendent failure rate and common cause failure rate:
k k i k c
k = component failure rate
k i = independent component failure rate
k c = common cause failure rate
k c
The beta factor has been defined as b
k c k i
This approach assigns high failure rates for similar redundant systems.
. Quantification of a common cause event tree is a more fundamental
approach, which generates more realistic data:
± Analysis and evaluation of alternatives for improved design
The above addresses common cause failures for a utility supply.
The prevention of losses of two or more utility supplies at the same time is of
even greater importance, as this can lead to high losses. This can only be adequately
realized by independent systems. A positive example is that of a redundant co-gen-
eration system where a gas turbine drives a power generator with waste heat boiler
for steam generation, while extraction air from the air compressor is dried and used
as instrument air. Such a system is independent as it generates its own power,
steam, and air. An assured boiler water supply is still a requirement which is in gen-
eral realized by sufficient storage. An overview is given of practical measures for
utility systems in Table 7.7.
Continuation of the methodology for site vulnerability evaluation brings us to:
. The transportation mode failures and its distribution of raw materials and
products, eventually completed with any delivery or supply requirements.
. The capacity of the storage facilities.
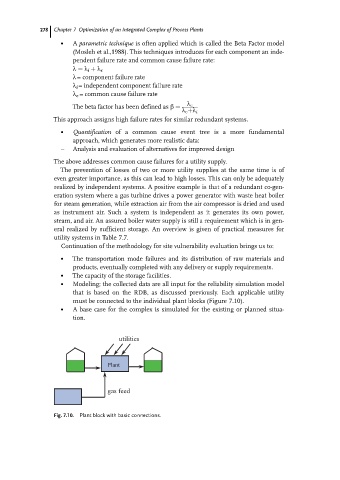
. Modeling; the collected data are all input for the reliability simulation model
that is based on the RDB, as discussed previously. Each applicable utility
must be connected to the individual plant blocks (Figure 7.10).
. A base case for the complex is simulated for the existing or planned situa-
tion.
utilities
Plant
gas feed
Fig. 7.10. Plant block with basic connections.