
Page 290 - Design of Simple and Robust Process Plants
P. 290
276 Chapter 7 Optimization of an Integrated Complex of Process Plants
Butenes
Transport Cracker Butadiene Poly butadiene
H2
SB latex
EB /Styrene Poly styrene
Benzene
Cyclo hexane
C5
C7
C8
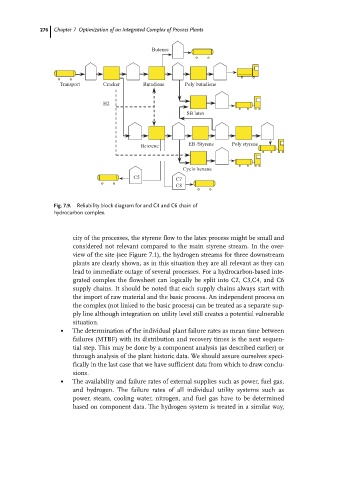
Fig. 7.9. Reliability block diagram for and C4 and C6 chain of
hydrocarbon complex.
city of the processes, the styrene flow to the latex process might be small and
considered not relevant compared to the main styrene stream. In the over-
view of the site (see Figure 7.1), the hydrogen streams for three downstream
plants are clearly shown, as in this situation they are all relevant as they can
lead to immediate outage of several processes. For a hydrocarbon-based inte-
grated complex the flowsheet can logically be split into C2, C3,C4, and C6
supply chains. It should be noted that each supply chains always start with
the import of raw material and the basic process. An independent process on
the complex (not linked to the basic process) can be treated as a separate sup-
ply line although integration on utility level still creates a potential vulnerable
situation.
. The determination of the individual plant failure rates as mean time between
failures (MTBF) with its distribution and recovery times is the next sequen-
tial step. This may be done by a component analysis (as described earlier) or
through analysis of the plant historic data. We should assure ourselves speci-
fically in the last case that we have sufficient data from which to draw conclu-
sions.
. The availability and failure rates of external supplies such as power, fuel gas,
and hydrogen. The failure rates of all individual utility systems such as
power, steam, cooling water, nitrogen, and fuel gas have to be determined
based on component data. The hydrogen system is treated in a similar way,