
Page 287 - Design of Simple and Robust Process Plants
P. 287
7.6 Optimization of Storage Capacity 273
. Mission time is 5 years, and the number of simulation runs was 60.
. The level control of the intermediate tanks was identical to the previous
example, with the set-point at a range of 45±55%.
. The storage capacity was widely varied.
. Capacity flows were 0, 60, 95, 100, and 105% of maximum capacity.
7.6.4.1 Simulation results
The simulation results are summarized to show the impact of the storage capacities.
The simulation of supply chains for optimization can among others also be solved
with software named ªArenaº from Systems Modeling Corporation. The reliability
level for the individual units varied, but for illustration of the storage capacity effect
these data were limited to one set. The availability of the individual units is listed in
Table 7.5.
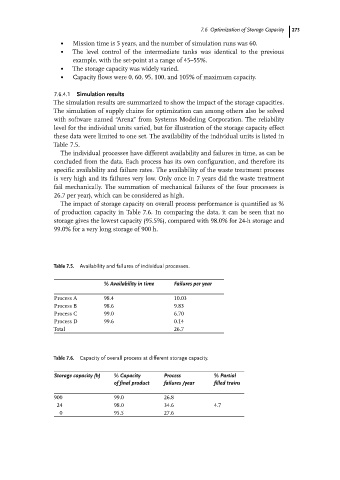
The individual processes have different availability and failures in time, as can be
concluded from the data. Each process has its own configuration, and therefore its
specific availability and failure rates. The availability of the waste treatment process
is very high and its failures very low. Only once in 7 years did the waste treatment
fail mechanically. The summation of mechanical failures of the four processes is
26.7 per year), which can be considered as high.
The impact of storage capacity on overall process performance is quantified as %
of production capacity in Table 7.6. In comparing the data, it can be seen that no
storage gives the lowest capacity (95.5%), compared with 98.0% for 24-h storage and
99.0% for a very long storage of 900 h.
Table 7.5. Availability and failures of individual processes.
% Availability in time Failures per year
Process A 98.4 10.03
Process B 98.6 9.83
Process C 99.0 6.70
Process D 99.6 0.14
Total 26.7
Table 7.6. Capacity of overall process at different storage capacity.
Storage capacity (h) % Capacity Process % Partial
of final product failures /year filled trains
900 99.0 26.8
24 98.0 34.6 4.7
0 95.5 27.6