
Page 283 - Design of Simple and Robust Process Plants
P. 283
7.6 Optimization of Storage Capacity 269
. The number of stops due to full or empty tank situations of respectively
upstream and downstream processes.
. The down-time as a result of full or empty tanks.
. The variation in tank level over time.
. The process (un)availability of upstream as well as downstream processes, in
% of time or hours per year.
. The process capacity in % of maximum capacity, calculated by summation of
the production intervals production capacity over mission time.
Through multiple simulations for different levels of process reliabilities and storage
capacity, the impact of these variables are obtained on process performance. It
should be noted that the results of the downstream process are mandatory for the
production performance, as it is here that the ultimate product is delivered.
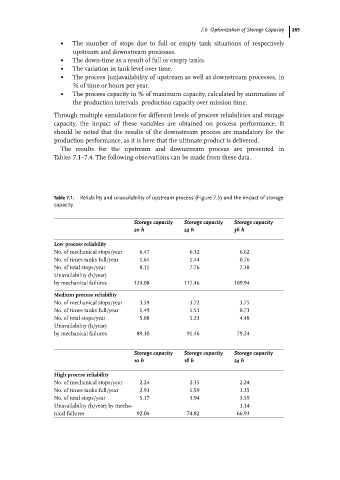
The results for the upstream and downstream process are presented in
Tables 7.1±7.4. The following observations can be made from these data.
Table 7.1. Reliability and unavailability of upstream process (Figure 7.5) and the impact of storage
capacity.
Storage capacity Storage capacity Storage capacity
20 h 24 h 36 h
Low process reliability
No. of mechanical stops/year 6.47 6.32 6.62
No. of times tanks full/year 1.64 1.44 0.76
No. of total stops/year 8.11 7.76 7.38
Unavailability (h/year)
by mechanical failures 124.08 117.46 109.94
Medium process reliability
No. of mechanical stops/year 3.59 3.72 3.75
No. of times tanks full/year 1.49 1.51 0.73
No. of total stops/year 5.08 5.23 4.48
Unavailability (h/year)
by mechanical failures 89.30 91.46 79.24
Storage capacity Storage capacity Storage capacity
10 h 18 h 24 h
High process reliability
No. of mechanical stops/year 2.24 2.35 2.24
No. of times tanks full/year 2.93 1.59 1.35
No. of total stops/year 5.17 3.94 3.59
Unavailability (h/year) by mecha- 1.14
nical failures 92.04 74.82 66.93