
Page 284 - Design of Simple and Robust Process Plants
P. 284
270 Chapter 7 Optimization of an Integrated Complex of Process Plants
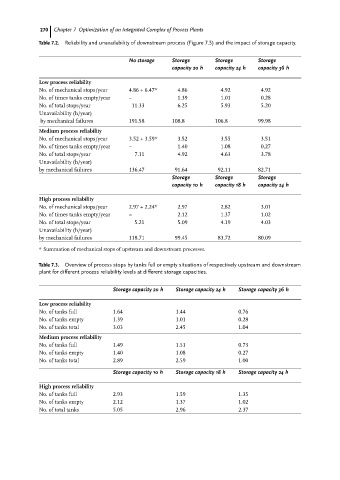
Table 7.2. Reliability and unavailability of downstream process (Figure 7.5) and the impact of storage capacity.
No storage Storage Storage Storage
capacity 20 h capacity 24 h capacity 36 h
Low process reliability
No. of mechanical stops/year 4.86 + 6.47* 4.86 4.92 4.92
No. of times tanks empty/year ± 1.39 1.01 0.28
No. of total stops/year 11.33 6.25 5.93 5.20
Unavailability (h/year)
by mechanical failures 191.58 108.8 106.8 99.98
Medium process reliability
No. of mechanical stops/year 3.52 + 3.59* 3.52 3.55 3.51
No. of times tanks empty/year ± 1.40 1.08 0,27
No. of total stops/year 7.11 4.92 4.63 3.78
Unavailability (h/year)
by mechanical failures 136.47 91.64 92.11 82.71
Storage Storage Storage
capacity 10 h capacity 18 h capacity 24 h
High process reliability
No. of mechanical stops/year 2.97 + 2.24* 2.97 2.82 3.01
No. of times tanks empty/year ± 2.12 1.37 1.02
No. of total stops/year 5.21 5.09 4.19 4.03
Unavailability (h/year)
by mechanical failures 118.71 99.45 83.72 80.09
* Summation of mechanical stops of upstream and downstream processes.
Table 7.3. Overview of process stops by tanks full or empty situations of respectively upstream and downstream
plant for different process reliability levels at different storage capacities.
Storage capacity 20 h Storage capacity 24 h Storage capacity 36 h
Low process reliability
No. of tanks full 1.64 1.44 0.76
No. of tanks empty 1.39 1.01 0.28
No. of tanks total 3.03 2.45 1.04
Medium process reliability
No. of tanks full 1.49 1.51 0.73
No. of tanks empty 1.40 1.08 0.27
No. of tanks total 2.89 2.59 1.00
Storage capacity 10 h Storage capacity 18 h Storage capacity 24 h
High process reliability
No. of tanks full 2.93 1.59 1.35
No. of tanks empty 2.12 1.37 1.02
No. of total tanks 5.05 2.96 2.37