
Page 281 - Design of Simple and Robust Process Plants
P. 281
7.6 Optimization of Storage Capacity 267
have an impact on the sizing of the storage tank. Planned plant shutdowns are
excluded from this study as it is assumed that during that time period special meas-
urements are taken to cope with storage provisions internal or external.
7.6.2
The Storage Tank
A storage tank design study is limited in this example to an intermediate storage
tank between process sections, as discussed in Section 6.4 in Chapter 6. The tank is
placed between the upstream and downstream process, and is simulated as a vol-
ume with a certain capacity. A clock is implemented in the flowsheet model, and a
capacity set point for each process is determined. During the simulation in time we
now calculate the inlet and outlet streams of the tank based on the actual capacity
flow over a time interval. The tank hold-up is determined at time intervals by balan-
cing the input and output streams of the tank. The tank is provided with a simple
level controller which manipulates the capacities of the upstream and downstream
processes to a definable algorithm. It functions in this example as follows.
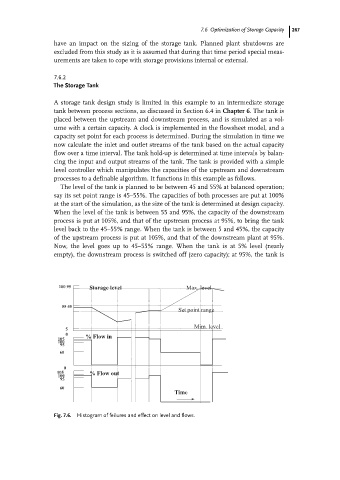
The level of the tank is planned to be between 45 and 55% at balanced operation;
say its set point range is 45±55%. The capacities of both processes are put at 100%
at the start of the simulation, as the size of the tank is determined at design capacity.
When the level of the tank is between 55 and 95%, the capacity of the downstream
process is put at 105%, and that of the upstream process at 95%, to bring the tank
level back to the 45±55% range. When the tank is between 5 and 45%, the capacity
of the upstream process is put at 105%, and that of the downstream plant at 95%.
Now, the level goes up to 45±55% range. When the tank is at 5% level (nearly
empty), the downstream process is switched off (zero capacity); at 95%, the tank is
100 95 Storage level Max. level
55 45
Set point range
Mim. level
5
0 % Flow in
105
100
95
60
0
105 % Flow out
100
95
60
Time
Fig. 7.6. Histogram of feilures and effect on level and flows.