
Page 285 - Design of Simple and Robust Process Plants
P. 285
7.6 Optimization of Storage Capacity 271
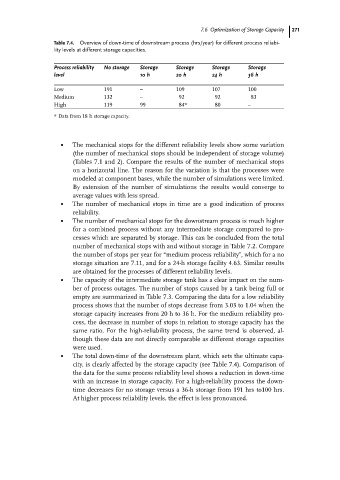
Table 7.4. Overview of down-time of downstream process (hrs/year) for different process reliabi-
lity levels at different storage capacities.
Process reliability No storage Storage Storage Storage Storage
level 10 h 20 h 24 h 36 h
Low 191 ± 109 107 100
Medium 132 ± 92 92 83
High 119 99 84* 80 ±
* Data from 18 h storage capacity.
. The mechanical stops for the different reliability levels show some variation
(the number of mechanical stops should be independent of storage volume)
(Tables 7.1 and 2). Compare the results of the number of mechanical stops
on a horizontal line. The reason for the variation is that the processes were
modeled at component bases, while the number of simulations were limited.
By extension of the number of simulations the results would converge to
average values with less spread.
. The number of mechanical stops in time are a good indication of process
reliability.
. The number of mechanical stops for the downstream process is much higher
for a combined process without any intermediate storage compared to pro-
cesses which are separated by storage. This can be concluded from the total
number of mechanical stops with and without storage in Table 7.2. Compare
the number of stops per year for ªmedium process reliabilityº, which for a no
storage situation are 7.11, and for a 24-h storage facility 4.63. Similar results
are obtained for the processes of different reliability levels.
. The capacity of the intermediate storage tank has a clear impact on the num-
ber of process outages. The number of stops caused by a tank being full or
empty are summarized in Table 7.3. Comparing the data for a low reliability
process shows that the number of stops decrease from 3.03 to 1.04 when the
storage capacity increases from 20 h to 36 h. For the medium reliability pro-
cess, the decrease in number of stops in relation to storage capacity has the
same ratio. For the high-reliability process, the same trend is observed, al-
though these data are not directly comparable as different storage capacities
were used.
. The total down-time of the downstream plant, which sets the ultimate capa-
city, is clearly affected by the storage capacity (see Table 7.4). Comparison of
the data for the same process reliability level shows a reduction in down-time
with an increase in storage capacity. For a high-reliability process the down-
time decreases for no storage versus a 36-h storage from 191 hrs to100 hrs.
At higher process reliability levels, the effect is less pronounced.