
Page 84 - Designing Sociable Robots
P. 84
breazeal-79017 book March 18, 2002 14:2
The Vision System 65
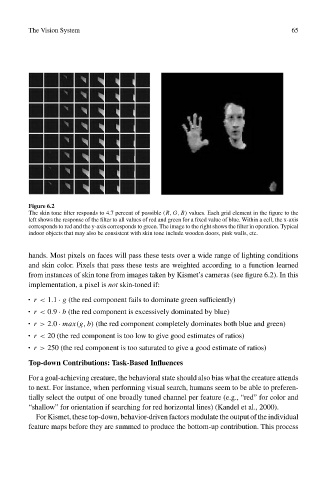
Figure 6.2
The skin tone filter responds to 4.7 percent of possible (R, G, B) values. Each grid element in the figure to the
left shows the response of the filter to all values of red and green for a fixed value of blue. Within a cell, the x-axis
corresponds to red and the y-axis corresponds to green. The image to the right shows the filter in operation. Typical
indoor objects that may also be consistent with skin tone include wooden doors, pink walls, etc.
hands. Most pixels on faces will pass these tests over a wide range of lighting conditions
and skin color. Pixels that pass these tests are weighted according to a function learned
from instances of skin tone from images taken by Kismet’s cameras (see figure 6.2). In this
implementation, a pixel is not skin-toned if:
• r < 1.1 · g (the red component fails to dominate green sufficiently)
• r < 0.9 · b (the red component is excessively dominated by blue)
r > 2.0 · max(g, b) (the red component completely dominates both blue and green)
•
r < 20 (the red component is too low to give good estimates of ratios)
•
• r > 250 (the red component is too saturated to give a good estimate of ratios)
Top-down Contributions: Task-Based Influences
For a goal-achieving creature, the behavioral state should also bias what the creature attends
to next. For instance, when performing visual search, humans seem to be able to preferen-
tially select the output of one broadly tuned channel per feature (e.g., “red” for color and
“shallow” for orientation if searching for red horizontal lines) (Kandel et al., 2000).
For Kismet, these top-down, behavior-driven factors modulate the output of the individual
feature maps before they are summed to produce the bottom-up contribution. This process