
Page 86 - Designing Sociable Robots
P. 86
breazeal-79017 book March 18, 2002 14:2
The Vision System 67
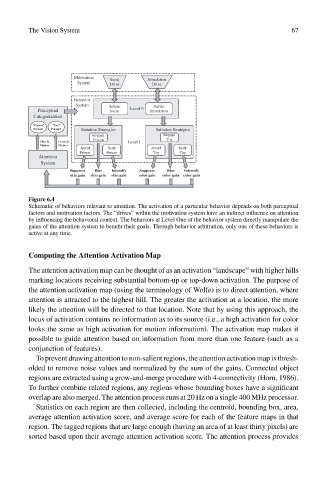
Motivation
Social Stimulation
System Drive Drive
Behavior
System Satiate Satiate
Perceptual Social Level 0 Stimulation
Categorization
“Person” “Toy”
Percept Percept Satiation Strategies Satiation Strategies
Engage Engage
Person Toy
Skin & Color & Level 1
Motion Motion
Avoid Seek Avoid Seek
Person Person Toy Toy
Attention
System
Suppress Bias Intensify Suppress Bias Intensify
skin gain skin gain skin gain color gain color gain color gain
Figure 6.4
Schematic of behaviors relevant to attention. The activation of a particular behavior depends on both perceptual
factors and motivation factors. The “drives” within the motivation system have an indirect influence on attention
by influencing the behavioral context. The behaviors at Level One of the behavior system directly manipulate the
gains of the attention system to benefit their goals. Through behavior arbitration, only one of these behaviors is
active at any time.
Computing the Attention Activation Map
The attention activation map can be thought of as an activation “landscape” with higher hills
marking locations receiving substantial bottom-up or top-down activation. The purpose of
the attention activation map (using the terminology of Wolfe) is to direct attention, where
attention is attracted to the highest hill. The greater the activation at a location, the more
likely the attention will be directed to that location. Note that by using this approach, the
locus of activation contains no information as to its source (i.e., a high activation for color
looks the same as high activation for motion information). The activation map makes it
possible to guide attention based on information from more than one feature (such as a
conjunction of features).
To prevent drawing attention to non-salient regions, the attention activation map is thresh-
olded to remove noise values and normalized by the sum of the gains. Connected object
regions are extracted using a grow-and-merge procedure with 4-connectivity (Horn, 1986).
To further combine related regions, any regions whose bounding boxes have a significant
overlap are also merged. The attention process runs at 20 Hz on a single 400 MHz processor.
Statistics on each region are then collected, including the centroid, bounding box, area,
average attention activation score, and average score for each of the feature maps in that
region. The tagged regions that are large enough (having an area of at least thirty pixels) are
sorted based upon their average attention activation score. The attention process provides