
Page 269 - Digital Analysis of Remotely Sensed Imagery
P. 269
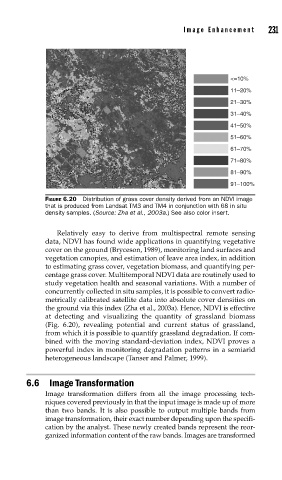
Image Enhancement       231


                                                                  <=10%
                                                                  11–20%
                                                                  21–30%
                                                                  31–40%
                                                                  41–50%
                                                                  51–60%
                                                                  61–70%
                                                                  71–80%
                                                                  81–90%
                                                                  91–100%

               FIGURE 6.20  Distribution of grass cover density derived from an NDVI image
               that is produced from Landsat TM3 and TM4 in conjunction with 68 in situ
               density samples. (Source: Zha et al., 2003a.) See also color insert.

                   Relatively easy to derive from multispectral remote sensing
               data, NDVI has found wide applications in quantifying vegetative
               cover on the ground (Bryceson, 1989), monitoring land surfaces and
               vegetation canopies, and estimation of leave area index, in addition
               to estimating grass cover, vegetation biomass, and quantifying per-
               centage grass cover. Multitemporal NDVI data are routinely used to
               study vegetation health and seasonal variations. With a number of
               concurrently collected in situ samples, it is possible to convert radio-
               metrically calibrated satellite data into absolute cover densities on
               the ground via this index (Zha et al., 2003a). Hence, NDVI is effective
               at detecting and visualizing the quantity of grassland biomass
               (Fig. 6.20), revealing potential and current status of grassland,
               from which it is possible to quantify grassland degradation. If com-
               bined with the moving standard-deviation index, NDVI proves a
               powerful index in monitoring degradation patterns in a semiarid
               heterogeneous landscape (Tanser and Palmer, 1999).


          6.6 Image Transformation
               Image transformation differs from all the image processing tech-
               niques covered previously in that the input image is made up of more
               than two bands. It is also possible to output  multiple bands from
               image transformation, their exact number depending upon the specifi-
               cation by the analyst. These newly created bands represent the reor-
               ganized information content of the raw bands. Images are transformed