Page 271 - Digital Analysis of Remotely Sensed Imagery
P. 271

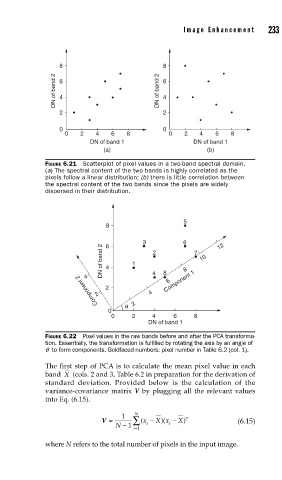
Image Enhancement       233


                   8                          2  8
                  DN of band 2  6 4            DN of band  6 4


                   2                            2

                   0                            0
                     0   2   4    6   8          0    2   4   6   8
                            DN of band 1                DN of band 1
                               (a)                          (b)
               FIGURE 6.21  Scatterplot of pixel values in a two-band spectral domain.
               (a) The spectral content of the two bands is highly correlated as the
               pixels follow a linear distribution; (b) there is little correlation between
               the spectral content of the two bands since the pixels are widely
               dispersed in their distribution.


                                                     5
                                8

                                          3          6         12
                                6
                               DN of band 2  4  1  2    7  10
                                                      8
                          4                  4  8 Component 1
                              Component 2  2
                                                 6
                             2              4
                                     θ  2
                                 0
                                  0    2     4     6    8
                                            DN of band 1
               FIGURE 6.22  Pixel values in the raw bands before and after the PCA transforma-
               tion. Essentially, the transformation is fulfi lled by rotating the axis by an angle of
               q  to form components. Boldfaced numbers: pixel number in Table 6.2 (col. 1).

               The first step of PCA is to calculate the mean pixel value in each
               band X (cols. 2 and 3, Table 6.2 in preparation for the derivation of
               standard deviation. Provided below is the calculation of the
               variance-covariance matrix V by plugging all the relevant values
               into Eq. (6.15).
                                        N
                               V =  1  ∑  x (  − X x  − X) T        (6.15)
                                                (
                                               )
                                   N  − 1  i     i
                                        i =1
               where N refers to the total number of pixels in the input image.
   266   267   268   269   270   271   272   273   274   275   276