
Page 276 - Digital Analysis of Remotely Sensed Imagery
P. 276
238 Cha pte r S i x
the components. The output pixel value in a component after trans-
formation is a linear combination of all the input pixel values
[Eq. (6.23)]. The transformed coordinates of the eight pixels are given
in the last two columns of Table 6.2.
y ⎛ ⎞ x ⎛ ⎞ ⎛ 0 8435 0 5372⎞ x ⎛ ⎞
.
.
1
1
1
⎟ ⎜ ⎟
⎜ ⎟ = ⎜ ⎟ = ⎜ − ⎝ 0 5372 0 8435⎠ x ⎝ ⎠ (6.23)
y ⎝ ⎠
x ⎝ ⎠
2 2 . . 2
G
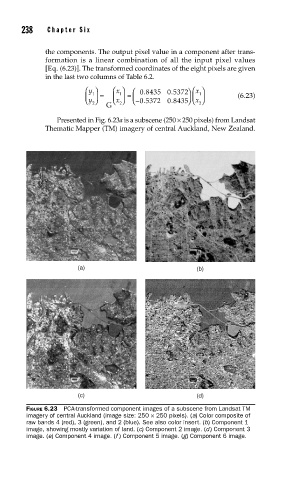
Presented in Fig. 6.23a is a subscene (250 × 250 pixels) from Landsat
Thematic Mapper (TM) imagery of central Auckland, New Zealand.
(a) (b)
(c) (d)
FIGURE 6.23 PCA-transformed component images of a subscene from Landsat TM
imagery of central Auckland (image size: 250 × 250 pixels). (a) Color composite of
raw bands 4 (red), 3 (green), and 2 (blue). See also color insert. (b) Component 1
image, showing mostly variation of land. (c) Component 2 image. (d) Component 3
image. (e) Component 4 image. (f ) Component 5 image. (g) Component 6 image.