
Page 277 - Digital Analysis of Remotely Sensed Imagery
P. 277
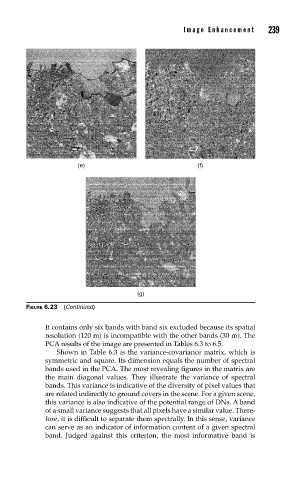
Image Enhancement       239


                        (e)                              (f)


                                         (g)
          FIGURE 6.23  (Continued)

               It contains only six bands with band six excluded because its spatial
               resolution (120 m) is incompatible with the other bands (30 m). The
               PCA results of the image are presented in Tables 6.3 to 6.5.
                   Shown in Table 6.3 is the variance-covariance matrix, which is
               symmetric and square. Its dimension equals the number of spectral
               bands used in the PCA. The most revealing figures in the matrix are
               the main diagonal values. They illustrate the variance of spectral
               bands. This variance is indicative of the diversity of pixel values that
               are related indirectly to ground covers in the scene. For a given scene,
               this variance is also indicative of the potential range of DNs. A band
               of a small variance suggests that all pixels have a similar value. There-
               fore, it is difficult to separate them spectrally. In this sense, variance
               can serve as an indicator of information content of a given spectral
               band. Judged against this criterion, the most informative band is