
Page 282 - Digital Analysis of Remotely Sensed Imagery
P. 282
244 Cha pte r S i x
Absent from the above equation is TM , which that has a spatial
6
resolution different from the remaining bands. This equation was
established from Landsat TM4 satellite data. The transformation coef-
ficients in the matrix would be slightly different if other TM satellite
data were used.
6.6.3 HIS Transformation
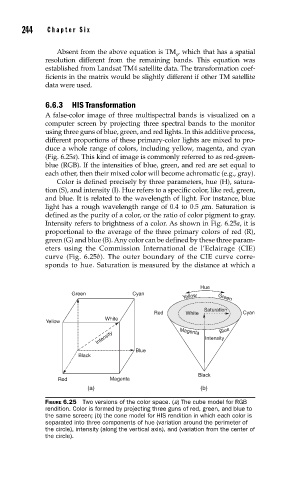
A false-color image of three multispectral bands is visualized on a
computer screen by projecting three spectral bands to the monitor
using three guns of blue, green, and red lights. In this additive process,
different proportions of these primary-color lights are mixed to pro-
duce a whole range of colors, including yellow, magenta, and cyan
(Fig. 6.25a). This kind of image is commonly referred to as red-green-
blue (RGB). If the intensities of blue, green, and red are set equal to
each other, then their mixed color will become achromatic (e.g., gray).
Color is defined precisely by three parameters, hue (H), satura-
tion (S), and intensity (I). Hue refers to a specific color, like red, green,
and blue. It is related to the wavelength of light. For instance, blue
light has a rough wavelength range of 0.4 to 0.5 mm. Saturation is
defined as the purity of a color, or the ratio of color pigment to gray.
Intensity refers to brightness of a color. As shown in Fig. 6.25a, it is
proportional to the average of the three primary colors of red (R),
green (G) and blue (B). Any color can be defined by these three param-
eters using the Commission International de l’Eclairage (CIE)
curve (Fig. 6.25b). The outer boundary of the CIE curve corre-
sponds to hue. Saturation is measured by the distance at which a
Hue
Green Cyan
Yellow Green
Saturation
Red White Cyan
White
Yellow
Blue
Intensity Intensity
Magenta
Blue
Black
Black
Red Magenta
(a) (b)
FIGURE 6.25 Two versions of the color space. (a) The cube model for RGB
rendition. Color is formed by projecting three guns of red, green, and blue to
the same screen; (b) the cone model for HIS rendition in which each color is
separated into three components of hue (variation around the perimeter of
the circle), intensity (along the vertical axis), and (variation from the center of
the circle).