
Page 278 - Digital Analysis of Remotely Sensed Imagery
P. 278
240 Cha pte r S i x
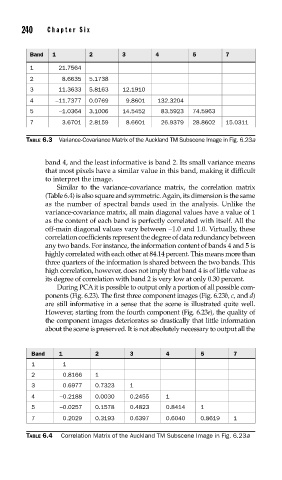
Band 1 2 3 4 5 7
1 21.7564
2 8.6635 5.1738
3 11.3633 5.8163 12.1910
4 −11.7377 0.0769 9.8601 132.3204
5 −1.0364 3.1006 14.5452 83.5923 74.5963
7 3.6701 2.8159 8.6601 26.9379 28.8602 15.0311
TABLE 6.3 Variance-Covariance Matrix of the Auckland TM Subscene Image in Fig. 6.23a
band 4, and the least informative is band 2. Its small variance means
that most pixels have a similar value in this band, making it difficult
to interpret the image.
Similar to the variance-covariance matrix, the correlation matrix
(Table 6.4) is also square and symmetric. Again, its dimension is the same
as the number of spectral bands used in the analysis. Unlike the
variance-covariance matrix, all main diagonal values have a value of 1
as the content of each band is perfectly correlated with itself. All the
off-main diagonal values vary between −1.0 and 1.0. Virtually, these
correlation coefficients represent the degree of data redundancy between
any two bands. For instance, the information content of bands 4 and 5 is
highly correlated with each other at 84.14 percent. This means more than
three quarters of the information is shared between the two bands. This
high correlation, however, does not imply that band 4 is of little value as
its degree of correlation with band 2 is very low at only 0.30 percent.
During PCA it is possible to output only a portion of all possible com-
ponents (Fig. 6.23). The first three component images (Fig. 6.23b, c, and d)
are still informative in a sense that the scene is illustrated quite well.
However, starting from the fourth component (Fig. 6.23e), the quality of
the component images deteriorates so drastically that little information
about the scene is preserved. It is not absolutely necessary to output all the
Band 1 2 3 4 5 7
1 1
2 0.8166 1
3 0.6977 0.7323 1
4 −0.2188 0.0030 0.2455 1
5 −0.0257 0.1578 0.4823 0.8414 1
7 0.2029 0.3193 0.6397 0.6040 0.8619 1
TABLE 6.4 Correlation Matrix of the Auckland TM Subscene Image in Fig. 6.23a