
Page 280 - Digital Analysis of Remotely Sensed Imagery
P. 280
242 Cha pte r S i x
be redistributed. As indicated by Eq. (6.20), all the squared figures in a
row sum to 1. So do all the squared figures in a column. The informa-
tion content of a spectral band is split into many parts among the com-
ponents. As shown in Table 6.6, the information content of band 1 is
allocated mainly to components 2 and 4. On the other hand, the infor-
mation content of the component 1 image originates mostly from band
4, albeit negatively. This means that the radiometric appearance of the
component 2 image resembles mostly that of band 4 in a reverse manner.
Namely, a bright tone in the spectral band shows up as a dark tone in the
component image, and vice versa. Similarly, the tonal appearance of com-
ponent 2 resembles that of spectral band 1 most among all the bands.
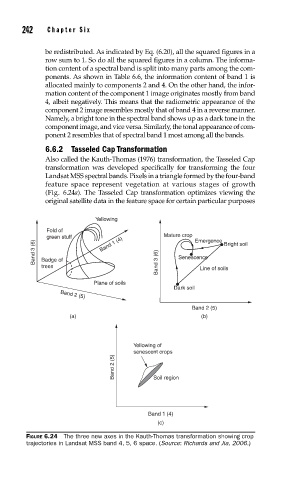
6.6.2 Tasseled Cap Transformation
Also called the Kauth-Thomas (1976) transformation, the Tasseled Cap
transformation was developed specifically for transforming the four
Landsat MSS spectral bands. Pixels in a triangle formed by the four-band
feature space represent vegetation at various stages of growth
(Fig. 6.24a). The Tasseled Cap transformation optimizes viewing the
original satellite data in the feature space for certain particular purposes
Yellowing
Fold of
green stuff Mature crop Emergence
3 (6) Band 1 (4) Bright soil
Band Badge of 3 (6) Senescence
Band Line of soils
trees
Plane of soils
Dark soil
Band 2 (5)
Band 2 (5)
(a) (b)
Yellowing of
senescent crops
Band 2 (5) Soil region
Band 1 (4)
(c)
FIGURE 6.24 The three new axes in the Kauth-Thomas transformation showing crop
trajectories in Landsat MSS band 4, 5, 6 space. (Source: Richards and Jia, 2006.)