
Page 239 - Dust Explosions in the Process Industries
P. 239
Generation of Explosible Dust Clouds 2 1 1
Instead, the tensile stress in the powder is concentratedin the region close to the bottom
of the cell, where the movable and stagnant bottom plates separate.When rupture occurs,
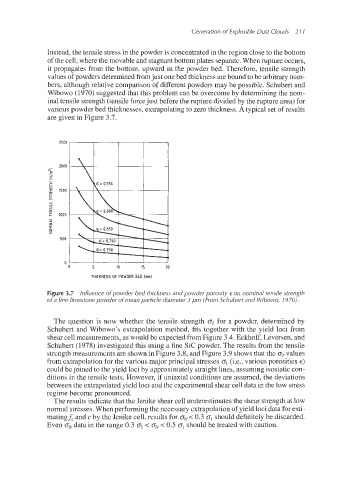
it propagates from the bottom, upward in the powder bed. Therefore, tensile strength
values of powders determined fromjust one bed thickness are bound to be arbitrary num-
bers, although relative comparison of different powders may be possible. Schubert and
Wibowo (1970) suggested that this problem can be overcome by determining the nom-
inal tensile strength (tensile forcejust before the rupture divided by the rupture area) for
various powder bed thicknesses, extrapolating to zero thickness.A typical set of results
are given in Figure 3.7.
- 2000
N
E
\
z
II
c
13
5 1500
t
500
0' 1 1 I I
0 5 10 15 20
THICKNESS OF POWDER BED [mml
Figure 3.7 Influence of powder bed thickness and powder porosity E on nominal tensile strength
of a fine limestone powder of mean particle diameter 3 pm (From Schubert and Wibowo, 1970).
The question is now whether the tensile strength 0, for a powder, determined by
Schubert and Wibowo's extrapolation method, fits together with the yield loci from
shear cell measurements,ips would be expected from Figure 3.4. Eckhoff,Leversen, and
Schubert (1978) investigated this using a fine Sic powder. The results from the tensile
strength measurements are shown in Figure 3.8, and Figure 3.9 shows that the q-values
from extrapolation for the various major principal stresses 0, (Le., various porosities E)
could be joined to the yield loci by approximatelystraight lines, assuming isostatic con-
ditions in the tensile tests. However, if uniaxial conditions are assumed, the deviations
between the extrapolatedyield loci and the experimental shear cell data in the low stress
regime become pronounced.
The results indicate that the Jenike shear cell underestimatesthe shear strength at low
normal stresses.When performingthe necessary extrapolationof yield loci data for esti-
matingf, and c by the Jenike cell, results for 0, < 0.3 0, should definitely be discarded.
Even 0,data in the range 0.3 0, < 0, < 0.5 0, should be treated with caution.