
Page 243 - Dust Explosions in the Process Industries
P. 243
Generation of Explosible Dust Clouds 2 15
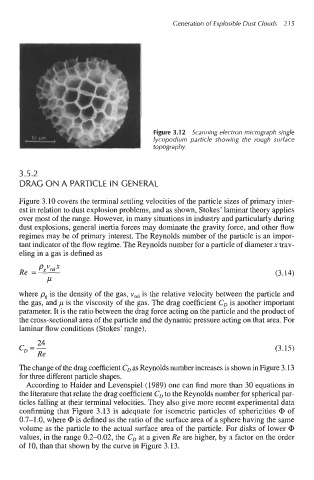
Figure 3.1 2 Scanning electron micrograph single
lycopodium particle showing the rough surface
topography.
3.5.2
DRAG ON A PARTICLE IN GENERAL
Figure 3.10 covers the terminal settling velocities of the particle sizes of primary inter-
est in relation to dust explosion problems, and as shown, Stokes' laminar theory applies
over most of the range. However, in many situations in industry and particularly during
dust explosions, general inertia forces may dominate the gravity force, and other flow
regimes may be of primary interest. The Reynolds number of the particle is an impor-
tant indicator of the flow regime. The Reynolds number for a particle of diameter x trav-
eling in a gas is defined as
(3.14)
where pp is the density of the gas, vIe1 is the relative velocity between the particle and
the gas, and p is the viscosity of the gas. The drag coefficient C4 is another important
parameter. It is the ratio between the drag force acting on the pmcle and the product of
the cross-sectional area of the particle and the dynamic pressure acting on that area. For
laminar flow conditions (Stokes' range),
24
c =- (3.15)
Re
The change of the drag coefficient C, as Reynolds number increases is shown in Figure 3.13
for three different particle shapes.
According to Haider and Levenspiel (1989) one can find more than 30 equations in
the literature that relate the drag coefficient C, to the Reynolds number for spherical par-
ticles falling at their terminal velocities. They also give more recent experimental data
confirming that Figure 3.13 is adequate for isometric particles of sphericities Q, of
0.7-1.0, where @ is defined as the ratio of the surface area of a sphere having the same
volume as the particle to the actual surface area of the particle. For disks of lower Q,
values, in the range 0.2-0.02, the C, at a given Re are higher, by a factor on the order
of 10, than that shown by the curve in Figure 3.13.