
Page 365 - Dust Explosions in the Process Industries
P. 365
334 Dust Explosions in the Process Industries
4.4.3.2
Experimental Investigations
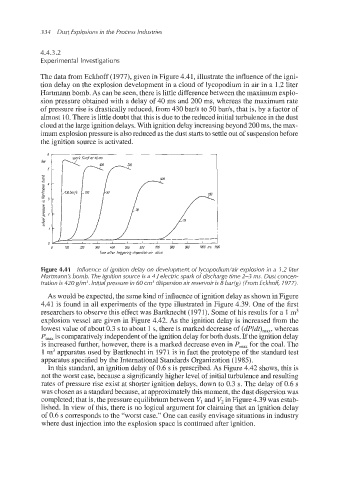
The data from Eckhoff (1977), given in Figure 4.41, illustrate the influence of the igni-
tion delay on the explosion development in a cloud of lycopodium in air in a 1.2 liter
Hartmann bomb. As can be seen, there is little differencebetween the maximum explo-
sion pressure obtained with a delay of 40 ms and 200 ms, whereas the maximum rate
of pressure rise is drastically reduced, from 430 bar/s to 50 barh, that is, by a factor of
almost 10.There is little doubt that this is due to the reduced initialturbulence in the dust
cloud at the large ignition delays.With ignition delay increasingbeyond 200 ms, the max-
imum explosion pressure is also reduced as the dust starts to settle out of suspensionbefore
the ignition source is activated.
a im 200 3w 400 500 600 7m BOO 9~ IOW ms ~1m
triggering
dispersion
air
time offer triggering dispersion air volvevolve
time
offer
Figure 4.41 Influence of ignition delay on development of lycopodium/air explosion in a 1.2 liter
Hartmann’s bomb. The ignition source is a 4 J electric spark ofdischarge time 2-3 ms. Dust concen-
tration is 420 g/m3.Initial pressure in 60 cm3dispersion air reservoir is 8 bar(g) (FromEckhof6 1977).
As would be expected,the same kind of influence of ignition delay as shown in Figure
4.41 is found in all experiments of the type illustrated in Figure 4.39. One of the first
researchers to observe this effect was Bartknecht (1971). Some of his results for a 1 m3
explosion vessel are given in Figure 4.42. As the ignition delay is increased from the
lowest value of about 0.3 s to about 1s, there is marked decrease of (dpldt),,, whereas
P,,, is comparatively independent of the ignitiondelay for both dusts. If the ignition delay
is increased further, however, there is a marked decrease even in P,, for the coal. The
1m3 apparatus used by Bartknecht in 1971 is in fact the prototype of the standard test
apparatus specified by the International Standards Organization (1985).
In this standard, an ignition delay of 0.6 s is prescribed. As Figure 4.42 shows, this is
not the worst case, because a significantlyhigher level of initial turbulence and resulting
rates of pressure rise exist at shorter ignition delays, down to 0.3 s. The delay of 0.6 s
was chosen as a standardbecause, at approximatelythis moment, the dust dispersion was
completed;that is, the pressure equilibriumbetween VI and V, in Figure 4.39 was estab-
lished. In view of this, there is no logical argument for claiming that an ignition delay
of 0.6 s corresponds to the “worst case.” One can easily envisage situations in industry
where dust injection into the explosion space is continued after ignition.