
Page 368 - Dust Explosions in the Process Industries
P. 368
Propagation of Flames in Dust Clouds 337
/OUTLET PORTS I81
[132OPTIONAL1
\TL+
DUST FEEDER
AIR lNLEl
INLET PORTS I61
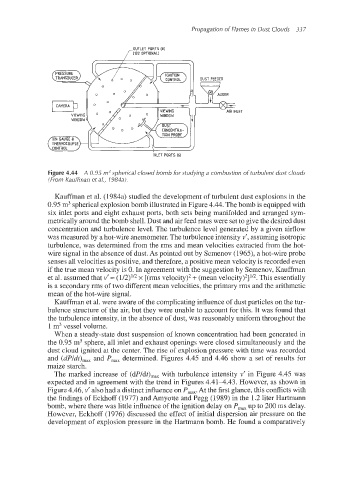
Figure 4.44 A 0.95 m3 spherical dosed bomb for studying a combustion of turbulent dust clouds
(From Kauffman et al., 1984a).
Kauffman et al. (1984a) studied the development of turbulent dust explosions in the
0.95 m3sphericalexplosionbomb illustrated in Figure 4.44. The bomb is equipped with
six inlet ports and eight exhaust ports, both sets being manifolded and arranged sym-
metrically around the bomb shell. Dust and air feed rates were set to give the desired dust
concentration and turbulence level. The turbulence level generated by a given airflow
was measured by a hot-wire anemometer.The turbulence intensity v’, assuming isotropic
turbulence, was determined from the rms and mean velocities extracted from the hot-
wire signal in the absence of dust. As pointed out by Semenov (1965), a hot-wire probe
senses all velocities as positive, and therefore, a positive mean velocity is recorded even
if the true mean velocity is 0. In agreement with the suggestionby Semenov, Kauffman
et a]. assumed that v’ = (1/2)1/2x [(rms velocity)’ + (mean ~elocity)~]’”.This essentially
is a secondaryrms of two different mean velocities, the primary rms and the arithmetic
mean oE the hot-wire signal.
Kauffman et al.were aware of the complicatinginfluence of dust particles on the tur-
bulence structure of the air, but they were unable to account for this. It was found that
the turbulence intensity, in the absence of dust, was reasonably uniform throughout the
1 m3 vessel volume.
When a steady-state dust suspension of known concentration had been generated in
the 0.95 m3 sphere, all inlet and exhaust openings were closed simultaneously and the
dust cloud ignited at the center. The rise of explosion pressure with time was recorded
and (dpldt),,, and P,,, determined. Figures 4.45 and 4.46 show a set of results for
maize starch.
The marked increase of (dP/dt),,, with turbulence intensity v’ in Figure 4.45 was
expected and in agreement with the trend in Figures 4.41-4.43. However, as shown in
Figure 4.46, v’ dso had a distinct influence on P,,. At the first glance,this conflicts with
the findings of Eckhoff (1977) and Amyotte and Pegg (1989) in the 1.2 liter Hartmann
bomb, where there was little influence of the ignition delay on P,, up to 200 ms delay.
However, Eckhoff (1976) discussed the effect of initial dispersion air pressure on the
development of explosion pressure in the Hartmann bomb. He found a comparatively