
Page 367 - Dust Explosions in the Process Industries
P. 367
336 Dust Explosions in the Process Industries
investigated by Eckhoff and Mathisen (1977l1978). They disclosed that a correlation
between (dpldt),, and dust moisture content found by Eckhoff (1976) on the basis of
Hartmann bomb tests, using a glowing resistance wire coil ignition source, was mis-
leading. The reason is that a dust of a higher moisture content ignites with a longer
delay than a comparatively dry dust, because the ignitability of a moist dust is lower than
for a dried dust. Therefore, ignition of the moist dust with a continuous source is not pos-
sible until the turbulence has decayed to a sufficiently low level, below the critical level
for ignition of the dried dust. In other words, as the moisture content in the dust increases,
the ignition delay also increases.Therefore,the strong influence of moisture content on
(dPldt),,, found earlier was in fact a combined effect of increasing dust moisture and
decreasing turbulence.
Eckhoff (1987) discussed a number of the closed-bombtest apparatuses used for char-
acterizing the explosion violence of dust clouds in terms of the maximum rate of pres-
sure rise. It is clear that the (dPldt),, from such tests are bound to be arbitrary as long
as the test result is not associated with a defined state of initial turbulence of the dust cloud.
In view of this, the direct measurements of the rms (root mean square) turbulence as a
function of time after opening the dispersion air valve in a Hartmann bomb by Amyotte
and Pegg (1989) and their comparison of the data with the data from Hartmann bomb
explosion experiments by themselves and Eckhoff (1977) are of considerable interest.
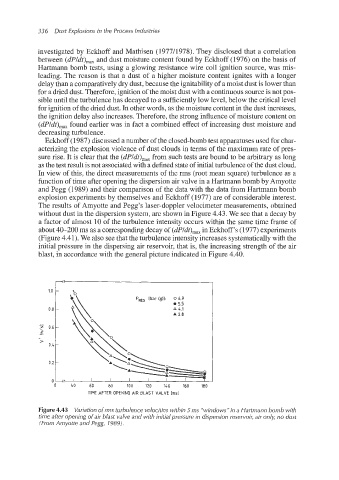
The results of Amyotte and Pegg’s laser-doppler velocimeter measurements, obtained
without dust in the dispersion system, are shown in Figure 4.43. We see that a decay by
a factor of almost 10 of the turbulence intensity occurs within the same time frame of
about 40-200 ms as a correspondingdecay of (dPldt),, in Eckhoff’s (1977) experiments
(Figure 4.41). We also see that the turbulence intensity increases systematically with the
initial pressure in the dispersing air reservoir, that is, the increasing strength of the air
blast, in accordance with the general picture indicated in Figure 4.40.
0 40 60 80 100 120 1&0 160 180
TIME AFTER OPENING AIR BLAST VALVE Imsl
Figure 4.43 Variation ofrrns turbulence velocities within 5 ms “windows”in a Hartrnann bomb with
time after opening of air blast valve and with initial pressure in dispersion reservoir, air only, no dust
(From Arnyotte and Pegg, 1989).