
Page 142 - Dynamic Vision for Perception and Control of Motion
P. 142
126 5 Extraction of Visual Features
5.1.1 Introduction to Feature Extraction
The amount of data collected by an imaging sensor is the same when looking at a
uniformly gray region or at a visually complex colored scene. However, the
amount of information perceived by an intelligent observer is considerably differ-
ent. A human would characterize the former case exhaustively by using just three
words: “uniformly gray”, and possibly a term specifying the gray tone (intensity).
The statement “uniformly” may be the result of rather involved low-level parallel
computations; but this high-level representational symbol in combination with the
intensity value contains all the information in the image. In contrast, if several ho-
mogeneously colored or textured subregions are being viewed, the borderlines be-
tween these regions and the specification of the color value per region contain all
the information about the scene (see Figure 5.2).
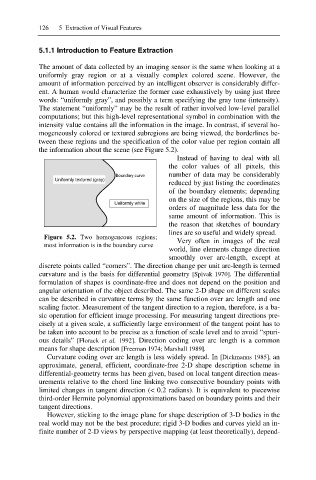
Instead of having to deal with all
the color values of all pixels, this
Boundary curve number of data may be considerably
Uniformly textured (gray)
reduced by just listing the coordinates
of the boundary elements; depending
on the size of the regions, this may be
Uniformly white
orders of magnitude less data for the
same amount of information. This is
the reason that sketches of boundary
lines are so useful and widely spread.
Figure 5.2. Two homogeneous regions;
Very often in images of the real
most information is in the boundary curve
world, line elements change direction
smoothly over arc-length, except at
discrete points called “corners”. The direction change per unit arc-length is termed
curvature and is the basis for differential geometry [Spivak 1970]. The differential
formulation of shapes is coordinate-free and does not depend on the position and
angular orientation of the object described. The same 2-D shape on different scales
can be described in curvature terms by the same function over arc length and one
scaling factor. Measurement of the tangent direction to a region, therefore, is a ba-
sic operation for efficient image processing. For measuring tangent directions pre-
cisely at a given scale, a sufficiently large environment of the tangent point has to
be taken into account to be precise as a function of scale level and to avoid “spuri-
ous details” [Florack et al. 1992]. Direction coding over arc length is a common
means for shape description [Freeman 1974; Marshall 1989].
Curvature coding over arc length is less widely spread. In [Dickmanns 1985], an
approximate, general, efficient, coordinate-free 2-D shape description scheme in
differential-geometry terms has been given, based on local tangent direction meas-
urements relative to the chord line linking two consecutive boundary points with
limited changes in tangent direction (< 0.2 radians). It is equivalent to piecewise
third-order Hermite polynomial approximations based on boundary points and their
tangent directions.
However, sticking to the image plane for shape description of 3-D bodies in the
real world may not be the best procedure; rigid 3-D bodies and curves yield an in-
finite number of 2-D views by perspective mapping (at least theoretically), depend-