
Page 185 - Dynamics and Control of Nuclear Reactors
P. 185
182 CHAPTER 13 Boiling water reactors
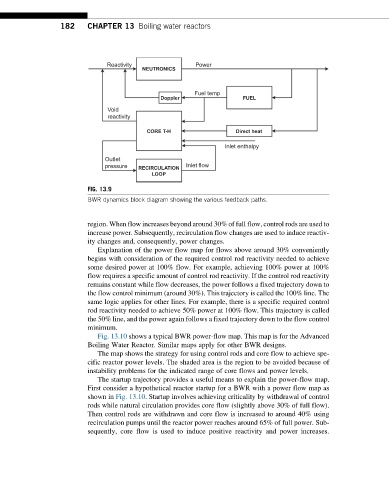
Reactivity Power
NEUTRONICS
Fuel temp
Doppler FUEL
Void
reactivity
CORE T-H Direct heat
Inlet enthalpy
Outlet
pressure RECIRCULATION Inlet flow
LOOP
FIG. 13.9
BWR dynamics block diagram showing the various feedback paths.
region. When flow increases beyond around 30% of full flow, control rods are used to
increase power. Subsequently, recirculation flow changes are used to induce reactiv-
ity changes and, consequently, power changes.
Explanation of the power flow map for flows above around 30% conveniently
begins with consideration of the required control rod reactivity needed to achieve
some desired power at 100% flow. For example, achieving 100% power at 100%
flow requires a specific amount of control rod reactivity. If the control rod reactivity
remains constant while flow decreases, the power follows a fixed trajectory down to
the flow control minimum (around 30%). This trajectory is called the 100% line. The
same logic applies for other lines. For example, there is a specific required control
rod reactivity needed to achieve 50% power at 100% flow. This trajectory is called
the 50% line, and the power again follows a fixed trajectory down to the flow control
minimum.
Fig. 13.10 shows a typical BWR power-flow map. This map is for the Advanced
Boiling Water Reactor. Similar maps apply for other BWR designs.
The map shows the strategy for using control rods and core flow to achieve spe-
cific reactor power levels. The shaded area is the region to be avoided because of
instability problems for the indicated range of core flows and power levels.
The startup trajectory provides a useful means to explain the power-flow map.
First consider a hypothetical reactor startup for a BWR with a power flow map as
shown in Fig. 13.10. Startup involves achieving criticality by withdrawal of control
rods while natural circulation provides core flow (slightly above 30% of full flow).
Then control rods are withdrawn and core flow is increased to around 40% using
recirculation pumps until the reactor power reaches around 65% of full power. Sub-
sequently, core flow is used to induce positive reactivity and power increases.