
Page 186 - Dynamics and Control of Nuclear Reactors
P. 186
13.10 On-line stability monitoring 183
130
NINE OF TEN INTERNAL PUMPS OPERATING
120 PERCENT PUMP SPEED
0 0 NATURAL CIRCULATION
110 1 30
2 35 10
3 40 9
100 100% POWER = 3926 MWt 8
4 50
5 60 7
6
90 6 70 100% FLOW = 52.2 X 10 kg/h 6
7 80 100% SPEED = 157 rad/s 4 A 5
90
PERCENT POWER 70 PERCENT ROD LINE 1 2 3 B C REGION IV
8
80
95
9
10 100
A 102
B 100
60
C 80
D 60
50
E 40
F20 0 D
REGION III
40
E
30
REGION II
20 REGION I F
TYPICAL STEAM SEPARATOR LIMIT
10 STARTUP
PATH
0
0 10 20 30 40 50 60 70 80 90 100 110 120
PERCENT CORE FLOW
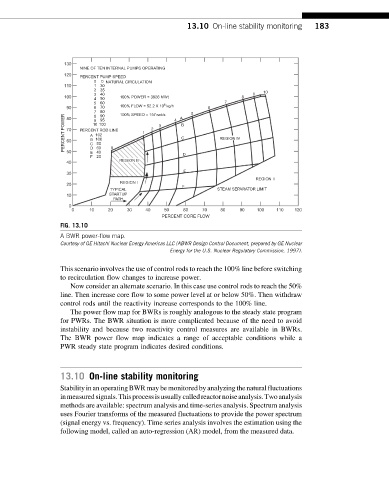
FIG. 13.10
A BWR power-flow map.
Courtesy of GE Hitachi Nuclear Energy Americas LLC (ABWR Design Control Document, prepared by GE Nuclear
Energy for the U.S. Nuclear Regulatory Commission, 1997).
This scenario involves the use of control rods to reach the 100% line before switching
to recirculation flow changes to increase power.
Now consider an alternate scenario. In this case use control rods to reach the 50%
line. Then increase core flow to some power level at or below 50%. Then withdraw
control rods until the reactivity increase corresponds to the 100% line.
The power flow map for BWRs is roughly analogous to the steady state program
for PWRs. The BWR situation is more complicated because of the need to avoid
instability and because two reactivity control measures are available in BWRs.
The BWR power flow map indicates a range of acceptable conditions while a
PWR steady state program indicates desired conditions.
13.10 On-line stability monitoring
Stability in an operating BWR may be monitored by analyzing the natural fluctuations
inmeasuredsignals.Thisprocessisusuallycalledreactornoiseanalysis.Twoanalysis
methods are available: spectrum analysis and time-series analysis. Spectrum analysis
uses Fourier transforms of the measured fluctuations to provide the power spectrum
(signal energy vs. frequency). Time series analysis involves the estimation using the
following model, called an auto-regression (AR) model, from the measured data.