
Page 35 - Earth's Climate Past and Future
P. 35
CHAPTER 1 • Overview of Climate Science 11
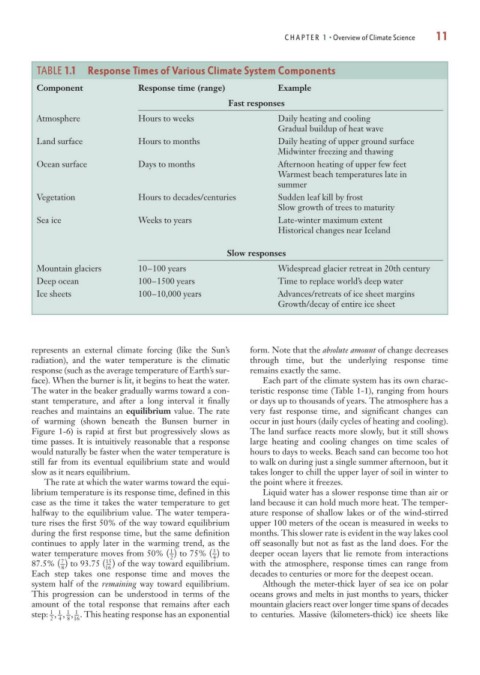
TABLE 1.1 Response Times of Various Climate System Components
Component Response time (range) Example
Fast responses
Atmosphere Hours to weeks Daily heating and cooling
Gradual buildup of heat wave
Land surface Hours to months Daily heating of upper ground surface
Midwinter freezing and thawing
Ocean surface Days to months Afternoon heating of upper few feet
Warmest beach temperatures late in
summer
Vegetation Hours to decades/centuries Sudden leaf kill by frost
Slow growth of trees to maturity
Sea ice Weeks to years Late-winter maximum extent
Historical changes near Iceland
Slow responses
Mountain glaciers 10–100 years Widespread glacier retreat in 20th century
Deep ocean 100–1500 years Time to replace world’s deep water
Ice sheets 100–10,000 years Advances/retreats of ice sheet margins
Growth/decay of entire ice sheet
represents an external climate forcing (like the Sun’s form. Note that the absolute amount of change decreases
radiation), and the water temperature is the climatic through time, but the underlying response time
response (such as the average temperature of Earth’s sur- remains exactly the same.
face). When the burner is lit, it begins to heat the water. Each part of the climate system has its own charac-
The water in the beaker gradually warms toward a con- teristic response time (Table 1-1), ranging from hours
stant temperature, and after a long interval it finally or days up to thousands of years. The atmosphere has a
reaches and maintains an equilibrium value. The rate very fast response time, and significant changes can
of warming (shown beneath the Bunsen burner in occur in just hours (daily cycles of heating and cooling).
Figure 1-6) is rapid at first but progressively slows as The land surface reacts more slowly, but it still shows
time passes. It is intuitively reasonable that a response large heating and cooling changes on time scales of
would naturally be faster when the water temperature is hours to days to weeks. Beach sand can become too hot
still far from its eventual equilibrium state and would to walk on during just a single summer afternoon, but it
slow as it nears equilibrium. takes longer to chill the upper layer of soil in winter to
The rate at which the water warms toward the equi- the point where it freezes.
librium temperature is its response time, defined in this Liquid water has a slower response time than air or
case as the time it takes the water temperature to get land because it can hold much more heat. The temper-
halfway to the equilibrium value. The water tempera- ature response of shallow lakes or of the wind-stirred
ture rises the first 50% of the way toward equilibrium upper 100 meters of the ocean is measured in weeks to
during the first response time, but the same definition months. This slower rate is evident in the way lakes cool
continues to apply later in the warming trend, as the off seasonally but not as fast as the land does. For the
3
1
water temperature moves from 50% (–) to 75% (–) to deeper ocean layers that lie remote from interactions
2 4
7
15
87.5% (–) to 93.75 (– ) of the way toward equilibrium. with the atmosphere, response times can range from
8 16
Each step takes one response time and moves the decades to centuries or more for the deepest ocean.
system half of the remaining way toward equilibrium. Although the meter-thick layer of sea ice on polar
This progression can be understood in terms of the oceans grows and melts in just months to years, thicker
amount of the total response that remains after each mountain glaciers react over longer time spans of decades
1 1
1 1
step: –, –, –, –. This heating response has an exponential to centuries. Massive (kilometers-thick) ice sheets like
2 4 8 16