
Page 37 - Earth's Climate Past and Future
P. 37
CHAPTER 1 • Overview of Climate Science 13
slightly during that brief interval, but then rise Heat applied
again. Volcanic eruptions are another example, such
as the 1991 summer explosion of Mount Pinatubo in
the Philippine Islands. Fine volcanic particles
produced by that eruption blocked part of the Water
Sun’s radiation for several months and caused temperature
Earth’s average temperature to fall by 0.5°C, but A
the cooling effect disappeared within a few years, Heat applied
because fine volcanic particles only stay in the
upper layers of the atmosphere for a few years
(see Table 1-1).
Water
• The time scales of forcing and climate response are temperature
similar. A more interesting situation lies between the B Time
two extremes: cases in which the time scale of the
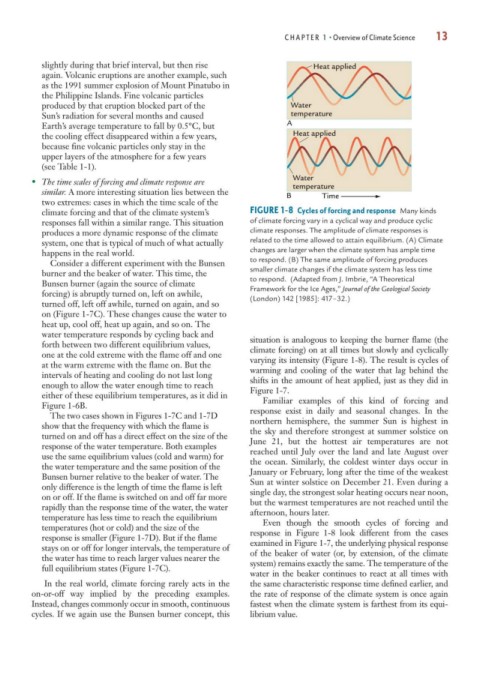
climate forcing and that of the climate system’s FIGURE 1-8 Cycles of forcing and response Many kinds
responses fall within a similar range. This situation of climate forcing vary in a cyclical way and produce cyclic
produces a more dynamic response of the climate climate responses. The amplitude of climate responses is
system, one that is typical of much of what actually related to the time allowed to attain equilibrium. (A) Climate
happens in the real world. changes are larger when the climate system has ample time
Consider a different experiment with the Bunsen to respond. (B) The same amplitude of forcing produces
burner and the beaker of water. This time, the smaller climate changes if the climate system has less time
Bunsen burner (again the source of climate to respond. (Adapted from J. Imbrie, “A Theoretical
forcing) is abruptly turned on, left on awhile, Framework for the Ice Ages,” Journal of the Geological Society
(London) 142 [1985]: 417–32.)
turned off, left off awhile, turned on again, and so
on (Figure 1-7C). These changes cause the water to
heat up, cool off, heat up again, and so on. The
water temperature responds by cycling back and
forth between two different equilibrium values, situation is analogous to keeping the burner flame (the
one at the cold extreme with the flame off and one climate forcing) on at all times but slowly and cyclically
at the warm extreme with the flame on. But the varying its intensity (Figure 1-8). The result is cycles of
intervals of heating and cooling do not last long warming and cooling of the water that lag behind the
enough to allow the water enough time to reach shifts in the amount of heat applied, just as they did in
either of these equilibrium temperatures, as it did in Figure 1-7.
Figure 1-6B. Familiar examples of this kind of forcing and
The two cases shown in Figures 1-7C and 1-7D response exist in daily and seasonal changes. In the
show that the frequency with which the flame is northern hemisphere, the summer Sun is highest in
turned on and off has a direct effect on the size of the the sky and therefore strongest at summer solstice on
response of the water temperature. Both examples June 21, but the hottest air temperatures are not
use the same equilibrium values (cold and warm) for reached until July over the land and late August over
the water temperature and the same position of the the ocean. Similarly, the coldest winter days occur in
Bunsen burner relative to the beaker of water. The January or February, long after the time of the weakest
only difference is the length of time the flame is left Sun at winter solstice on December 21. Even during a
on or off. If the flame is switched on and off far more single day, the strongest solar heating occurs near noon,
rapidly than the response time of the water, the water but the warmest temperatures are not reached until the
temperature has less time to reach the equilibrium afternoon, hours later.
temperatures (hot or cold) and the size of the Even though the smooth cycles of forcing and
response is smaller (Figure 1-7D). But if the flame response in Figure 1-8 look different from the cases
stays on or off for longer intervals, the temperature of examined in Figure 1-7, the underlying physical response
the water has time to reach larger values nearer the of the beaker of water (or, by extension, of the climate
full equilibrium states (Figure 1-7C). system) remains exactly the same. The temperature of the
water in the beaker continues to react at all times with
In the real world, climate forcing rarely acts in the the same characteristic response time defined earlier, and
on-or-off way implied by the preceding examples. the rate of response of the climate system is once again
Instead, changes commonly occur in smooth, continuous fastest when the climate system is farthest from its equi-
cycles. If we again use the Bunsen burner concept, this librium value.