
Page 177 - Educational Technology A Primer for the 21st Century
P. 177
10.3 Design of an Educational Project 169
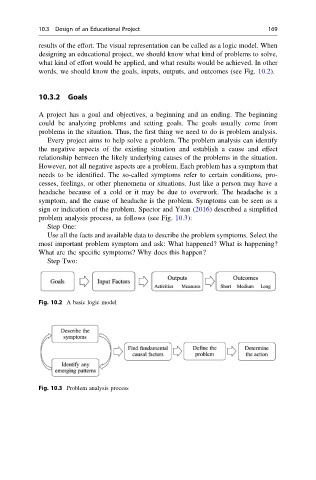
results of the effort. The visual representation can be called as a logic model. When
designing an educational project, we should know what kind of problems to solve,
what kind of effort would be applied, and what results would be achieved. In other
words, we should know the goals, inputs, outputs, and outcomes (see Fig. 10.2).
10.3.2 Goals
A project has a goal and objectives, a beginning and an ending. The beginning
could be analyzing problems and setting goals. The goals usually come from
problems in the situation. Thus, the first thing we need to do is problem analysis.
Every project aims to help solve a problem. The problem analysis can identify
the negative aspects of the existing situation and establish a cause and effect
relationship between the likely underlying causes of the problems in the situation.
However, not all negative aspects are a problem. Each problem has a symptom that
needs to be identified. The so-called symptoms refer to certain conditions, pro-
cesses, feelings, or other phenomena or situations. Just like a person may have a
headache because of a cold or it may be due to overwork. The headache is a
symptom, and the cause of headache is the problem. Symptoms can be seen as a
sign or indication of the problem. Spector and Yuan (2016) described a simplified
problem analysis process, as follows (see Fig. 10.3):
Step One:
Use all the facts and available data to describe the problem symptoms. Select the
most important problem symptom and ask: What happened? What is happening?
What are the specific symptoms? Why does this happen?
Step Two:
Fig. 10.2 A basic logic model
Fig. 10.3 Problem analysis process