
Page 136 - Electrical Installation in Hazardous Area
P. 136
102 Electrical installations in hazardous areas
10
7
5
3
2
1
0.7
0.5
0.3
0.2
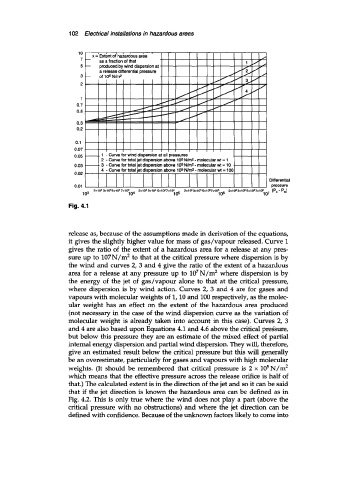
0.05 -. 1 - Curve for wind dispersion at all pressures
2 - Curve for total jet dispersion above 105 N/m* - molecular wt = 1
0.03 -. 3 - Curve for total jet dispersion above 105 N/m2 - molecular wt = 10
4 - Curve for total jet dispersion above 105 N/m2- molecular wt = 100
0.02 -
Differential
0.01 pressure
release as, because of the assumptions made in derivation of the equations,
it gives the slightly higher value for mass of gas/vapour released. Curve 1
gives the ratio of the extent of a hazardous area for a release at any pres-
sure up to 107N/m2 to that at the critical pressure where dispersion is by
the wind and curves 2,3 and 4 give the ratio of the extent of a hazardous
area for a release at any pressure up to 107N/m2 where dispersion is by
the energy of the jet of gas/vapour alone to that at the critical pressure,
where dispersion is by wind action. Curves 2, 3 and 4 are for gases and
vapours with molecular weights of 1/10 and 100 respectively, as the molec-
ular weight has an effect on the extent of the hazardous area produced
(not necessary in the case of the wind dispersion curve as the variation of
molecular weight is already taken into account in this case). Curves 2, 3
and 4 are also based upon Equations 4.1 and 4.6 above the critical pregsure,
but below this pressure they are an estimate of the mixed effect of partial
internal energy dispersion and partial wind dispersion. They will, therefore,
give an estimated result below the critical pressure but this will generally
be an overestimate, particularly for gases and vapours with high molecular
weights. (It should be remembered that critical pressure is 2 x 10⁵N/m2
which means that the effective pressure across the release orifice is half of
that.) The calculated extent is in the direction of the jet and so it can be said
that if the jet direction is known the hazardous area can be defined as in
Fig. 4.2. This is only true where the wind does not play a part (above the
critical pressure with no obstructions) and where the jet direction can be
defined with confidence. Because of the unknown factors likely to come into