
Page 65 -
P. 65
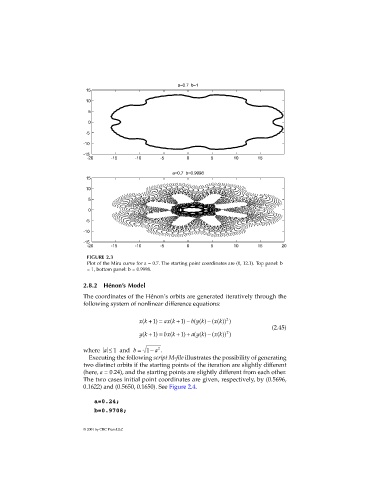
a=0.7  b=1
                             15
                             10

                              5
                              0
                             -5
                             -10

                             -15
                              -20     -15     -10     -5       0       5      10      15
                                                          a=0.7  b=0.9998
                             15

                             10
                              5
                              0
                             -5
                             -10

                             -15
                              -20     -15     -10     -5       0       5      10      15      20
                              FIGURE 2.3
                              Plot of the Mira curve for a = 0.7. The starting point coordinates are (0, 12.1). Top panel: b
                              = 1, bottom panel: b = 0.9998.

                             2.8.2  Hénon’s Model

                             The coordinates of the Hénon’s orbits are generated iteratively through the
                             following system of nonlinear difference equations:


                                                                            2
                                               xk( + 1 ) =  ax k( + 1 ) − b y k( ( ) (−  xk( )) )
                                                                                           (2.45)
                                                                            2
                                               yk( + 1 ) =  bx k( + 1 ) +  a yk( ( ) (−  x k( )) )
                             where  a ≤ 1 and  b = 1 −  a 2 .
                              Executing the following script M-file illustrates the possibility of generating
                             two distinct orbits if the starting points of the iteration are slightly different
                             (here, a = 0.24), and the starting points are slightly different from each other.
                             The two cases initial point coordinates are given, respectively, by (0.5696,
                             0.1622) and (0.5650, 0.1650). See Figure 2.4.

                                a=0.24;
                                b=0.9708;


                             © 2001 by CRC Press LLC