
Page 63 -
P. 63
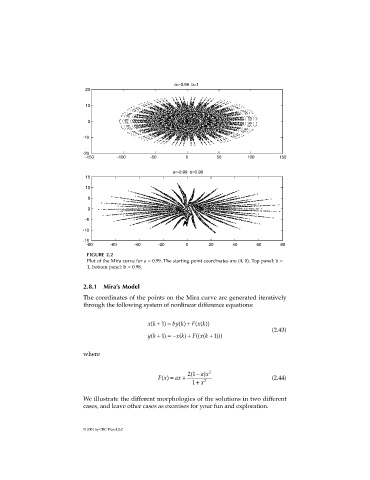
FIGURE 2.2
                              Plot of the Mira curve for a = 0.99. The starting point coordinates are (4, 0). Top panel: b =
                              1, bottom panel: b = 0.98.


                             2.8.1  Mira’s Model
                             The coordinates of the points on the Mira curve are generated iteratively
                             through the following system of nonlinear difference equations:


                                                  xk( + 1 ) = by k( ) +  F xk( ( ))
                                                                                           (2.43)
                                                  yk( + 1 ) = − x k( ) +  F x k(( ( + 1 )))

                             where


                                                                ( −
                                                     Fx () =  ax +  21  ax )  2            (2.44)
                                                                 1 +  x 2


                             We illustrate the different morphologies of the solutions in two different
                             cases, and leave other cases as exercises for your fun and exploration.


                             © 2001 by CRC Press LLC