Page 301 - Elements of Chemical Reaction Engineering 3rd Edition
P. 301

Chap. 5  Questions and Problems                                 273

                                                            TABLE P5-10  RAW DATA
                                                                        Ozone         Butene
                                                       Ozone Rate     Concentration   Concentration
                                              Run   (moUs. dm3 X  lo7)   ( mol/dm3)   (moUdm3)
                                               1          1.5            0.01         10-12
                                               2          3.2            0.0%         10-1'
                                               3          3.5            0.0 I5       10;'O
                                               4          5 .O           0.005        10-9'
                                               5          8.8            0.001        10-8
                                               6          4.7            O.OL8        10-9
                                              (Hint: Ozone also decomposes by collision with the wall)

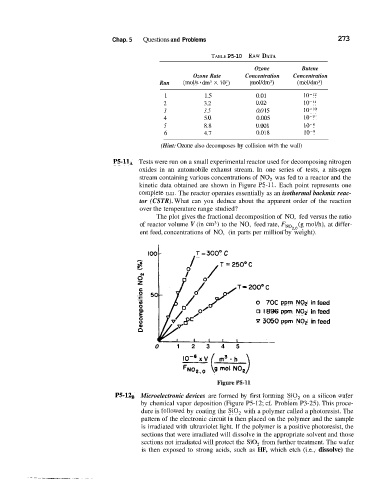
                                 P5-11,  Tests were run on a small experimental reactor used for decomposing nitrogen
                                        oxides  in  an  automobile  exhaust  stream. In  one  series  of  tests,  a  nits-ogen
                                        stream containing various concentrations of  NO,  was fed to a reactor and the
                                        kinetic data obtained are shown in Figure P5-11. Each point represents one
                                        comple1.e run. The reactor operates essentially as an isothermal backmix reac-
                                        tor (CSTR). What  can  you  deduce about the  apparent order  of  the reaction
                                        over the temperature range studied?
                                             The plot gives the fractional decomposition of  NO,  fed versus the ratio
                                        of reactor volume V (in cm3) to the NO,  feed rate, FNo2,,(g molh), at differ-
                                        ent feed, concentrations of  NO,  (in parts per million by weight).


                                                       .T = 300' C


                                                                                PPm  NO2 in feed
                                                                         0 1896  Ppm  NOp in feed
                                                                         V 3050  PPm  NO2 in feed


                                            0     1    2   3   4   5


                                                              Figure P5-11
                                 P5-128 Microelectronic devices  are formed by  first forming  SiO,  on a silicon .wafer
                                        by  chemical vapor deposition (Figure P5-12; cf. Problem P3-25). This proce-
                                         dure is fiollowed by coating the SiO,  with a polymer called a photoresist. The
                                         pattern of the electronic circuit is then placed on the polymer and the sample
                                         is irradiated with ultraviolet light. If the polymer is a positive photoresist, the
                                         sections that were irradiated will dissolve in the appropriate solvent and those
                                         sections not irradiated will protect the SO, from further treatment. The wafer
                                         is  then  exposed to  strong acids, such  as  HF,  which etch  (ie.,  dissolve) the
   296   297   298   299   300   301   302   303   304   305   306