
Page 192 - Encyclopedia of Business and Finance
P. 192
eobf_C 7/5/06 2:57 PM Page 169
Cost-Volume-Profit Analysis
costs sit on top of fixed costs, line DE. Point F represents
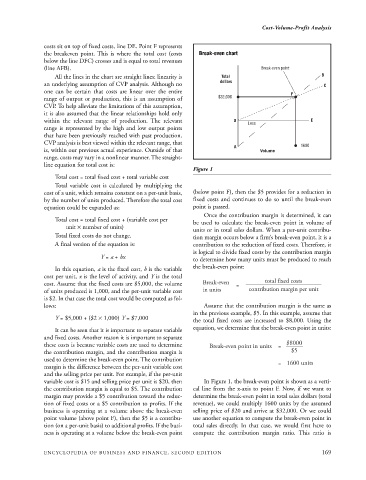
the breakeven point. This is where the total cost (costs Break-even chart
below the line DFC) crosses and is equal to total revenues
(line AFB). Break-even point
All the lines in the chart are straight lines: linearity is Total B
dollars
an underlying assumption of CVP analysis. Although no C
one can be certain that costs are linear over the entire F
range of output or production, this is an assumption of $32,000
CVP. To help alleviate the limitations of this assumption,
it is also assumed that the linear relationships hold only
within the relevant range of production. The relevant D E
Loss
range is represented by the high and low output points
that have been previously reached with past production.
CVP analysis is best viewed within the relevant range, that
A 1600
is, within our previous actual experience. Outside of that Volume
range, costs may vary in a nonlinear manner. The straight-
line equation for total cost is:
Figure 1
Total cost = total fixed cost + total variable cost
Total variable cost is calculated by multiplying the
cost of a unit, which remains constant on a per-unit basis, (below point F), then the $5 provides for a reduction in
by the number of units produced. Therefore the total cost fixed costs and continues to do so until the break-even
equation could be expanded as: point is passed.
Once the contribution margin is determined, it can
Total cost = total fixed cost + (variable cost per be used to calculate the break-even point in volume of
unit ¥ number of units)
units or in total sales dollars. When a per-unit contribu-
Total fixed costs do not change. tion margin occurs below a firm’s break-even point, it is a
A final version of the equation is: contribution to the reduction of fixed costs. Therefore, it
is logical to divide fixed costs by the contribution margin
Y = a + bx
to determine how many units must be produced to reach
the break-even point:
In this equation, a is the fixed cost, b is the variable
cost per unit, x is the level of activity, and Y is the total
cost. Assume that the fixed costs are $5,000, the volume Break-even = total fixed costs
of units produced is 1,000, and the per-unit variable cost in units contribution margin per unit
is $2. In that case the total cost would be computed as fol-
lows: Assume that the contribution margin is the same as
in the previous example, $5. In this example, assume that
Y = $5,000 + ($2 ¥ 1,000) Y = $7,000 the total fixed costs are increased to $8,000. Using the
It can be seen that it is important to separate variable equation, we determine that the break-even point in units:
and fixed costs. Another reason it is important to separate
these costs is because variable costs are used to determine Break-even point in units = $8000
the contribution margin, and the contribution margin is $5
used to determine the break-even point. The contribution = 1600 units
margin is the difference between the per-unit variable cost
and the selling price per unit. For example, if the per-unit
variable cost is $15 and selling price per unit is $20, then In Figure 1, the break-even point is shown as a verti-
the contribution margin is equal to $5. The contribution cal line from the x-axis to point F. Now, if we want to
margin may provide a $5 contribution toward the reduc- determine the break-even point in total sales dollars (total
tion of fixed costs or a $5 contribution to profits. If the revenue), we could multiply 1600 units by the assumed
business is operating at a volume above the break-even selling price of $20 and arrive at $32,000. Or we could
point volume (above point F), then the $5 is a contribu- use another equation to compute the break-even point in
tion (on a per-unit basis) to additional profits. If the busi- total sales directly. In that case, we would first have to
ness is operating at a volume below the break-even point compute the contribution margin ratio. This ratio is
ENCYCLOPEDIA OF BUSINESS AND FINANCE, SECOND EDITION 169